
As some readers will be aware NISRA produced a report last week regarding 2017 data on the composition of the workforce here.
The Labour force survey religion report (2017) contains a wealth of data including some very interesting post Census 2011 demographic data as well as historical comparisons.
The report runs to 83 pages and goes into considerable detail. It can be accessed in full Here.
For the purpose of this blog I will look at the demographic changes revealed and how they are driving the changes that are now becoming apparent in society and how those changes are, in fact, accelerating.
Looking firstly at the relevant Community characteristics, it is clear that the direction of travel is only one way.
From the Report:
“There were 643,000 Protestants aged 16 and over in 1990; in 2017 this figure has
decreased, to 612,000. Over this period, the number of Catholics increased by 165,000, or
38%, from 440,000 to 605,000. The number of people aged 16 and over classified as
‘other/non-determined’ has more than trebled from 63,000 to 245,000 between 1990 and
2017″
That is a 7000 person gap between the two primary blocs or 0.6%.
Over this period Protestants (42%) have declined by 14% while Catholics (41%) have increased by 3%. The “Other” cohort has increased from 6% to 17%.
Remember that the figures are from two years ago and clearly the “Other” classification has grown substantially over the period, the question regarding this cohort is which way they would be likely to vote in the coming Border Poll.
It is clear from the above that those from a Catholic background have a net gain of at least 196,000 over the period up to 2017.
If we look at those of Working Age only, (16-59), again from the report:
“Over this period (1990 – 2017), the number of Protestants of working age decreased by 10% (from
495,000 to 446,000), the number of working age Catholics increased by 36% (from
375,000 to 509,000), and the number of those classified as ‘other/non-determined’ more
than quadrupled (from 53,000 to 216,000)”
If we break down the age cohorts further we can see the following:
| Age (2017) | Catholic | Protestant |
| 16+ | 41% | 42% |
| 16 – 24 | 45% | 33% |
| 16 – 59 | 43% | 38% |
| 60+ | 35% | 54% |
In other words we can see that protestants are now a minority amongst those of working age. this is an accelerating trend as the proportion of elderly/ retired protestants is obviously higher than for catholics. (The elderly and retired don’t tend to be prominent in the childbearing cohorts).
Another area of note is the analysis of Household type across the different cohorts.
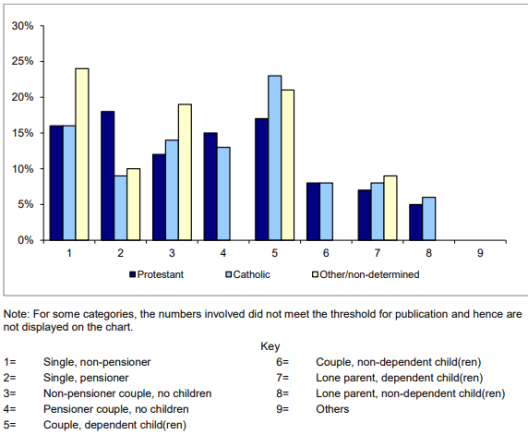
The above chart from the NISRA report, demonstrates that the only cohorts where protestants are in the majority are single pensioners and pensioner couples with no children.
The implications of this for the future trends should require no further explaination.
For brevity and given the focus of our site here, I haven’t gone into great detail on all aspects of the report but I would urge everyone to have a read in depth using the link provided above.
I’m aware the report is a religion rather than a political analysis. I’m sure the DUP “outreach to Catholics” project is progressing well as always.
It’s, as always, important not to conflate Catholics with Nationalists or Protestants with Unionists in an absolute way but it should be clear that the “Other” cohort is key to where we will be going next. This is a subject Faha has covered on this site previously. I have my own thoughts on the subject but as always things will come down to the votes cast in the next election cycles.
I’m also sure that intelligent unionists know what’s coming down the line and are trying to warn their representatives. As Peter Robinson discovered, that can provoke unfortunate responses from the Sammy Wilson’s of this world.
As always, further research, comment and analysis, from whatever source, is very welcome.
PS: Just one small detail I haven’t mentioned…………… Brexit

BD,
2 potential issues(old chesnuts really)
1) Some of the Catholics may be the wrong type of Catholics – i.e. from outside of Ireland and not give a flying feck about the constitutional question
2) There is far more ‘Prods’ in the no religion category – when you look at it by
constituency.
So although the direction of travel may be clear – the arrival date in a UI is anything but.
LikeLiked by 1 person
Indeed Sammy.
regarding your points, 1) I’d refer ye to the correllation between the catholic percentage and the nationalist vote – they tend to be very close for whatever reason..
2) I’d argue point 2 but what evidence do you have?
LikeLike
Point 1: Differential turnout is a complicating factor and I’m not saying it pints in one way or another – and although you may say it skews the figures towards Unionism – I’m saying just that it is a complicating factor on top of an extrapolation..
Point 2: Admittedly it was ages ago but I compared East and West Belfast and East was much higher for non religion.
LikeLike
The “wrong type of Catholics” are mainly EU nationals who are strongly opposed to Brexit since it threatens their very livelihood in Northern Ireland. They will vote for a UI so they can remain in the EU. Those that have been polled by Lucid Talk and others have shown zero support for remaining in the UK (Edit BD) with a Hard Brexit.
LikeLike
The change in the Protestant %, between the 16-59 age bracket (38%), & the 16-24 group (33%), suggests that Sammy has a point, I think. The birth rate cannot have collapsed that much.
LikeLike
Muiris – I don’t think the differential is caused by a massive drop in the birthrate. Unionist young people tend to go to Uni/College in England and Scotland and tend to stay there after they graduate. They get jobs, settle down with partners from England and Scotland they maybe met at University and don’t return to NI.
LikeLike
Thank you Ben. I had heard of this ‘unionist flight’ , but have no way of knowing how anecdotal or real, a factor it might be. Sammy also referred to the ‘non religion’ in E. Belfast, which was the point I was alluding to mainly ( I think )
LikeLike
I think the Protestant No Religon thing began in North Down and spread out into Belfast and other surrounding areas. Either that or Van Morrison has a lot to answer for.
LikeLiked by 2 people
What we need is more NIPPLES or Northern Ireland Professional Protestants Living in England or Scotland. So it is Nationalist interests that young Protestants do well in school and go off to England or Scotland and never come home again. Hopefully Brexit won’t screw all that up.
LikeLike
I believe this annual survey is becoming increasingly inaccurate due to the increasing numbers of people who are unwilling to answer the religion question. If you look at the survey done 2 years earlier in 2015 for the entire 16+ population there were 633,000 Protestants, 633,000 Catholics and 180,000 Other/Non determined. In 2017 there were 612,000 Protestants, 605,000 Catholics and 245,000 Other/Non determined. It is not possible that there could be an increase of 65,000 people with Other or No Religion in only 2 years. Those extra 65,000 people are mainly those who are unwilling to provide their religion background. In 2015 the percentages for the 16 to 24 age groups were 36% Protestant, 51% Catholic and 13% Other/Non determined. That is almost identical to the school census numbers for Protestant, Catholic and Other/None/Other Christian. In 2017 the percentages were 33% Protestant, 45% Catholic and 22% Other/ Non determined. It is not possible that the percentage of people with Other/No religion could have increased from 13% to 22% in only 2 years for the 16 to 24 age cohort.
LikeLike
The stats in this report are, of course, based upon the labour market. Anecdotally I know that a large proportion of gene pool catholics identify as “other” as do protestants also.
The point is that the unionist majority is now gone across several measures – political, workforce, education and, I am sure, demographically in the wider population.
The composition of the “Other” cohort is a matter for debate of course and tends to be fluid but the reaction to the reality of minority status, like the rest of us, is a litmus test of leadership for political unionism
LikeLiked by 1 person
I think the statistics for the 16 to 24 age group in 2015 are the most significant- 36% Protestant and 51% Catholic. This is the future. The Other/None group are now 2 to 1 in favour of a United Ireland with a Hard Brexit according to recent polls.
LikeLike
LikeLike
Catholics to be majority of workforce in Northern Ireland for first time in 2020, new figures suggest.
Headline in Bel Tel, today 7th Feb 2019
LikeLike
The perception that Protestants Unionists ‘own’ and ‘pay for’ the state is being overturned. As the new reality sets in, the sense of entitlement of Unionist voters will fade, as it must, for them to psychologically prepare for the day that the majority vote to end the Union.
LikeLike
This in a poll conducted by Sky News: Meanwhile, our poll found that the majority of people in the Republic of Ireland would back Irish unity – 64% support (34% strongly), 16% oppose (6% strongly), with 18% answering neither and 4% don’t know.
There’ s a job of work to be done in convincing political parties in the Republic that campaigning for unity is a vote winner. Real engagement instead of platitudes would be an absolute gamechanger.
https://news.sky.com/story/sky-data-poll-irish-overwhelmingly-back-governments-pressure-on-backstop-11629673
LikeLike
Off-subject, a bit, but I’m glad to see a legal challenge to the redrawn, DUP-friendly, Westminster constituency boundaries.
https://www.belfasttelegraph.co.uk/news/northern-ireland/court-allows-belfast-man-to-challenge-boundary-commission-plans-37804171.html
LikeLike
Far from off topic Antain, many thanks for that
LikeLiked by 1 person
If there is a border poll Nationalism is in a win/win situation. If they win the border poll well its a United Ireland. If they lose but narrowly Unionists are going to have to wise up and try and accommodate Nationalism in the North otherwise there is going to be another border poll in seven years.
LikeLike
https://www.express.co.uk/news/uk/1086911/no-deal-brexit-news-irish-border-united-ireland-border-poll-michael-cullinane
LikeLike
Anna Soubry, Heidi Allen, Sarah Wollaston have QUIT the Conservative Party.
LikeLike
Who is to say how dare you strive and aspire for better? Telling you no doubt a special place in hell reserved for those with such views.
Perhaps they should have added what we really need now is not a Border Poll but rather an Inquisition to examine if the immortal soul of Mother Ireland is in peril by such dangerous heretical talk.
Recently there has been a marked increase in gaslighting and it simply just cannot be put down to electioneering alone. Runs far deeper and too systemic for that.
Some of the sources are to be expected however this time joined by those who suppose to know better.
One thing these recent attempts at gaslighting with all the energy expended therein tells me is they have no ideas of their own. With nothing to offer except to say to everyone wait – wait for your rights.
Imagine if these same people who disparage us all now were at key pivotal events. In Berlin on a certain day they would have said to the locals stop as the wall will tumble itself. Or even back with The Civil Rights Association in its time naming it as watery protestors or a crocodile moment. For Martin Luther King Jnr. then to be told it is only a dream.
So it is obvious by listening to eternal pessimists and naysayers nothing will ever be achieved.
When all you said that rankles so is that is not good enough.
LikeLike
The UN have just found that Britain acted illegally by hiving off part of Mauritius, as the price of independence.
Precedent made. Ireland’s case must surely come next.
We won’t need a parachute payment or a dowry.
The fine for the damage that their criminal activity has caused will cover repair costs.
LikeLike
https://www.theguardian.com/commentisfree/2019/feb/26/hard-brexit-united-ireland-second-referendum-dup
LikeLike
He’s got that right.
If the great British public can be bothered to read past the first line or two, they might actually learn something about the real consequences of Brexit on their Union.
Not much fear of that though, so roll on the Border Poll and UI.
LikeLiked by 1 person
https://www.bbc.co.uk/news/uk-northern-ireland-47420316
Report on BBC website today. 27% of uni students from now go to university in the UK. It would be interesting to see if the report gives the background details of students. Anecdotally my kids go to grammar school in Newry, and I think only a tiny proportion go to the uk
LikeLike
https://m.belfasttelegraph.co.uk/news/republic-of-ireland/united-ireland-will-happen-in-five-years-claims-senator-37874220.html
LikeLike
https://m.belfasttelegraph.co.uk/news/northern-ireland/exsdlp-leader-mark-durkan-to-run-for-fine-gael-in-european-elections-37876567.html
LikeLike
I like Mark Durkan, but he’s slipped in my estimation following this move to give FG a try out. At least the other blusterers, Currie and Cushnahan actually permanently changed party.
Where does that leave the SDLP. Looks like they’ve given up on Foyle.
Totally undermines their FF merger plans or any hopes of keeping the party together.
Now SDLP members can add FG to the list of vultures looking to pick over their bones.
LikeLike
The DUP didn’t quite think this Brexit thing through did they? Instead of driving a political wedge between North and South like they wanted they have in fact brought us all a lot closer together. Long may it continue.
LikeLike