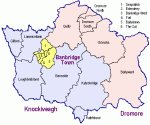
Banbridge marks the southernmost, unionist majority area, of the North. The 2011 council results were:
Votes by Party:
UUP: 6,167 (33.8%), 7 councillors
DUP: 5,904 (32.4%), 5 councillors
SDLP: 2,409 (13.2%), 2 councillors
SF: 2,071 (11.4%), 2 councillors
Alliance: 892 (4.9%), 1 councillor
TUV: 458 (2.5%)
Ind: 335 (1.8%)
The comparison totals since 2001 are:
| Total | Catholic | Protestant | Other | None | |
| 2001 | 41,400 | 13,024 | 27,337 | 109 | 930 |
| 2011 | 48,339 | 15,479 | 29,979 | 361 | 2,520 |
| 2001 | 31.46% | 66.03% | 0.26% | 2.25% | |
| 2011 | 32.02% | 62.02% | 0.75% | 5.21% |
As may be seen above there is little change in the overall percentages except for the increase in the “None” cohort, a 4% drop in protestants and a marginal 0.6% increase in catholics. The interesting stuff, as always, is in the detail (below). Rathfriland is greening quickly with a swing of 14.4%. Dromore, always a unionist town, is surprising with a 10.8% swing. In the town itself it appears that Banbridge West and Ballydown, to the south east, are changing in their demographic makeup. I have included an extra column this time with the total catholic percentage in each Ward.
| Catholic Change | Protestant Change | Catholic % 2011 | |
| 95FF01 Ballydown | 3.7% | -7.8% | 30.7% |
| 95FF02 Ballyward | -1.5% | -0.4% | 56.5% |
| 95FF03 Banbridge West | 2.3% | -6.7% | 38.5% |
| 95FF04 Bannside | -0.4% | -2.6% | 37.6% |
| 95FF05 Dromore North | 0.5% | -4.5% | 18.3% |
| 95FF06 Dromore South | 3.2% | -8.6% | 14.3% |
| 95FF07 Edenderry | 0.9% | -4.3% | 48.6% |
| 95FF08 Fort | -2.1% | -1.2% | 27.5% |
| 95FF09 Gilford | -2.2% | -1.1% | 39.3% |
| 95FF10 Gransha | 0.9% | -4.2% | 13.9% |
| 95FF11 Katesbridge | 0.6% | -4.5% | 29.8% |
| 95FF12 Lawrencetown | -0.3% | -2.3% | 53.6% |
| 95FF13 Loughbrickland | -0.2% | -2.3% | 35.0% |
| 95FF14 Quilly | 1.5% | -4.8% | 14.4% |
| 95FF15 Rathfriland | 6.3% | -8.1% | 38.5% |
| 95FF16 Seapatrick | 0.3% | -2.4% | 22.9% |
| 95FF17 The Cut | -2.9% | -2.0% | 35.7% |
| TOTALS | 0.6% | -4.0% |


The interesting thing for me is how this plays out in Upper Bann. My perception ..and it’s only that …is that when we talk of Upper Bann …we tend to mean Lurgan and Portadown…but there’s actually a very solid vote in Banbridge.
To some extent Banbridge politics are complicated by the fact that there is three constituencies in the council area…South Down, Lagan Valley and Upper Bann.
Within the town, SDLP dropped a lot of votes in 2011…losing votes to SF but winning back a few from Alliance.
And in the rural Upper Bann part, SDLP is comfortably ahead of Sinn Fein and last time round Alliance didn’t stand.
Fact is that Upper Bann and Craigavon is much more high profile…a fault line…and Banbridge is low profile.
LikeLike
Banbridge is a bit of a backwater – but interesting in demographic terms.
1000 extra people in Gransha ward (Kinallen and thereabouts) – where to hell did they come from? Ditto for the 1200 in suburban Ballydown?
Rathfriland is greening fast – but what happened to Gilford?
LikeLike
Ballydown has had a lot of new housing – a generally pleasant area.
LikeLike
Yes, but the new people have to come from somewhere. That’s the question I was asking.
LikeLike
No idea!
LikeLike
Banbridge seems to have a few strands in terms of immigration (which is large). It was often cited by journalists as a Fortress town along with Limavady, as somewhere that P’s from the West were withdrawing to. But it’s not very Fortress like and so is also attractive to many C’s due to good quality houses. location, size, atmosphere etc. It is only coincidence that proportions of those arriving are similar to the existing C / P %.
Is Gilford, like Bleary in so far as it could become a satelite for P’s from Portadown/Craigavon ?
Any idea why these mixed areas of Lawerencetown, Loughbrickland and Gilford exist as enclaves in a solidy P belt ? Bad farmland? Servant/farm labour villages to Big Estates? Former Lough/River communities? (ditto for Rasharkin and Dunloy)
LikeLike
Gilford is as close to Portadown as it is to Banbridge but it’s only grown slightly in population terms. AFAIK there’s not much new-build there so people starting out would be moving to Lawrencetown (same parish), Banbridge or some of the new developments on the edge of Portadown. The history of the place is as a mill village.
LikeLike
You mention Banbridge as a ‘fortress’, though these days it’s fairly mixed. I’ll wager the new development in Ballydown is attracting blow-ins from Newry, of both persuasions, some of them commuting to Belfast.
Now Rathfriland, up on a hill overlooking the upper reaches of the Bann, has the aura of a real frontier town. As the dub has pointed out it is the one area which has seen a sizable shift in the sectarian demographics.
LikeLike
What is encouraging here is that there seems to be more mixing going on – the most Catholic areas are becoming less Catholic, and the most protestant areas are becoming more Catholic, with very little overall change.
LikeLike
Banbridge district has always been pretty mixed. It was not badly affected by our most recent troubles. Perhaps that makes it an attractive place to live.
LikeLike
The trend seems to be that only overwhelmingly catholic areas (80% plus) seem to be increasing their protestant percentages while, majority protestant and mixed areas are increasing their catholic percentages.
There is obviously a social/ class element to this in urban areas as well.
LikeLike
There aren’t really any 80% Catholic areas in Banbridge district. It’s generally pretty mixed, though the area round Dromore is predominantly Protestant. Banbridge seems to be pulling in people from neighbouring boroughs – Newry, Craigavon, Lisburn.
LikeLike
I believe I read once its one of the places where the public housing estates managed to remain mixed. Not sure if this is true.
LikeLike
Hi all,
I’m planning on doing Antrim next as it is one of the more interesting areas changewise. Also I have a feeling it may be a unionist unity target for the next round of elections. Any opinions?
LikeLike
Good idea.
(By the way on the other blog regarding rugby I meant the schools up north not the Dublin ones)
LikeLike
Cheers,
I did answer you as below:
No Problem Factual:
http://www.ulsterrugby.com/branch/schools/contacts.php
At least two CBS schools in there plus, guess what? St Patricks And Our Ladys College mentioned above plus plenty of others. By the way, the above list includes all of ulster as I’m sure you meant.
NB* Above comment is on FJH Blog (Link http://fitzjameshorselooksattheworld.wordpress.com/2013/03/19/congratulations-to-st-patricks-and-our-ladys-college/#comment-9015)
LikeLike
re the Rugby.
I read some years ago that the “Catholic” school on Derry also plays rugby.
LikeLike
There is more than one Catholic school in Derry, I suspect, FJH
LikeLike
I suspect St Columbs is the one. It’s on the list
LikeLike
Interesting if you look at that Interactive tool which shows the output areas. Three green fingers are gradually converging on Banbridge – from the north-west, the south and the east.
LikeLike
Well spotted FF,
You have a point there
LikeLike
Proposals for school closures/mergers etc
http://www.puttingpupilsfirst.info/index.php/draft-area-plans
For those with some time to spare – should give an interesting reflection on changing demographics as well as one of the key factors attracting young couples to an area
LikeLike
This is a great opportunity to introduce more integrated education, as schools which are unviable can be merged into a single school, bringing the two religious groups closer together, which can only be a good thing for society.
LikeLike
That’s a good point and faith probably shouldn’t have a leading role in education anyway. it will reduce sectarianism but it will also reduce the momentum for political change. For those who think that this is it, then it would be good to make them all integrated right now. I personally think that we mightn’t be too far away from the day when the CNR community have the power to decide their political future (probably a reformed NI) and for me that’s the best time to drive integrated education and bury the bulk of the past for good.
LikeLike
I’m from Dublin but moved to Rathfriland last year. There seems to be a feeling around here that what was once a PUL stronghold is now very much a mixed community. It will be interesting to see how the census results in 2021 play out. Going by the completely unscientific method of ‘looking around as I go about my business’ I would say that a lot of the older people in the town are from a Protestant background, whereas the young families tend to be Catholic.
As Fear Feirsteach said above, it has the aura of a real frontier town. It can at times feel caught in a tug of war between Newry/Mourne and Banbridge. There appears to be a consensus that “the shops are better” in Newry than in Banbridge, and Newry is seen as a better night out, with less trouble than you might find in Banbridge. Whilst fairly self contained, it appears that Rathfriland folk look more to Newry than they do to Banbridge, and it certainly has the feel of a town on the turn.
LikeLike
I think it was the PUL folk in Rathfriland who succesfully campaigned a few years back to have the ward moved from Newry & Mourne to Banbridge, presumably to be in a Unionist controlled council area.
If the demographics there continue to change at the same rate, Rathfriland will be a nett contributor to Banbridge becoming a split council where Alliance hold the balance of power.
LikeLike
RJC,
Can I recommend Rathfriland Dub as a name for your forthcoming blog 😉
Paul,
100% correct about that little gerrymander.
LikeLike