Ballymoney. Part two of the bible belt series Ladies and Gents.
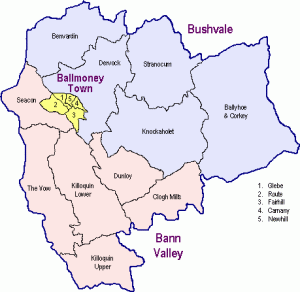
Below are the statistical changes by ward for Ballymoney. Does anyone know what is happening in Killoquin? North and south? Has anyone noticed yet that the increase in the “none” and “other” allocation seems to balance with the reduction in the “unionist” percentage while the “catholic” percentages steadily increase?
Overall there is little change here other than a 3.5 % swing in the green direction. The balance is 63%/ 32% Protestants/ Catholics in 2011 from 66%/ 31% in 2001.
2011 Council results were: (See below)
DUP: 2,069 (42.3%), 3 seats
SF: 1,664 (34.0%), 2 seats
TUV: 440 (9.0%), 1 seat
SDLP: 373 (7.6%)
UUP: 345 (7.1%)
NB* Correction!
The full council figures are:
8 DUP
3 SF
2 UUP
1 TUV
1 SDLP
1 Independent.
An over representation for nationalists perhaps?
| Catholic Change | Protestant Change | |
| 95EE01 Ballyhoe and Corkey | -1.2% | 0.2% |
| 95EE02 Benvardin | 0.6% | -5.8% |
| 95EE03 Carnany | -0.6% | -2.3% |
| 95EE04 Clogh Mills | -2.7% | 0.0% |
| 95EE05 Dervock | 3.2% | -6.2% |
| 95EE06 Dunloy | -2.5% | 1.5% |
| 95EE07 Fairhill | -1.1% | -3.1% |
| 95EE08 Glebe | 0.8% | -4.7% |
| 95EE09 Killoquin Lower | -2.9% | -1.0% |
| 95EE10 Killoquin Upper | 3.3% | -5.4% |
| 95EE11 Knockaholet | 0.0% | -2.7% |
| 95EE12 Newhill | 1.1% | -4.3% |
| 95EE13 Route | -1.6% | -2.5% |
| 95EE14 Seacon | 3.0% | -7.6% |
| 95EE15 Stranocum | 4.0% | -8.3% |
| 95EE16 The Vow | -1.8% | -1.7% |
| Total | 0.1% | -3.4% |


Killoquin Upper covers Rasharkin if I’m correct.
LikeLike
Rasharkin is split between Killoquin Upper and Lower but most of the village is in Upper. Catholics seem to be moving into the village and Protestants out towards Finvoy.
LikeLike
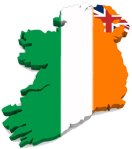
Great graphic from An Sionnach. Enscapsulates everything about the last century in Ireland. The injustice of Partition, the nullification of democracy in favour of xenophobic supremacy and the disgrace/cowardlyness/treachery of the Free State establishment in acquiescing in the maintainance of this ‘Blight’.
LikeLike
Yawn. Just in from checking on the pheasants for the forthcoming season on my planter estate here. Must get the old lads over from Eton for that shoot in May. Saw a hovel, must belong to a bog Irish brood. I’ll have to get the land agent to pull it down when I’m off for the season in Mayfair. Remind me to send some cash from my high rents down to cousin Randolph at the Bank of Ireland; one must help out the Establishment remnants down there to stop the Jerries taking over. I’ll see him at the rugger, no doubt. Huzzah!
LikeLike
Bit of a reflex there Carrick! You bemoaning the crown losing most of ‘the Emerald Isle’ and being stuck with having to allign with those paraidigms of loyalty willie McCrea, Davy Tweed, Paul Berry; scantimonious kiljoys who’d u’ll never be able to share a Cheltenham or Fulham pubs post Twickenham moment of craic with. An alien species to all on the mainland, who you got on the rebound when the proud Gaels rejected your embrace.
LikeLike
Regards to cousin Randolph. He is a good egg.
LikeLike
Carrickally,
Well said old chap! Perhaps the vast majority of unionists, and I know what you mean, would make themselves heard then and stop allowing the narrative to be dictated by the lunatic fringe?
LikeLike
There has been a signifigant growth in parts of Ballymoney town and in the predominantly unionist villages to the north and west. Benvardin ward put on 500 people, Seacon 700, The Vow 400, Newhill 600. This would appear to represent an influx of people into the borough. where are they coming from?
LikeLike
I read on P.IE that it was people profiting from the crazy prices in Colraine, or being priced out of Colraine/Ballymena and choosing Ballymoney as a base near their old stomping grounds.
Clogh Mills is a ward that looked like it was going to go 50/50, as in the last census Catholic/Protestant births we’re pretty even from 5-15 in the 2001 census. But, I conjecture, rural fundamentalist Unionists feeling threatened by the nationalist demographics, a paranoia accentuated by a percived threat from the 1998 Good Friday agrrement, increased their birth rate. Thus ladies in their late 30s early 40s did their bit for Queen and Ulster, evidence the sharp rise on Protestant births in the 0-4 age grouping. This is a trend I also noticed from 2001 census in Derg Electoral division, rural wards of Cookstown and Armagh District council. And without the age breakdown figures being released for 2011 I’d guess it explains as much as nationalist emigration why the Unionist figures have held up in many rural districts.
Glenarm in Larne District would be similiar to Clogh Mills.
LikeLike
The local catholic primary in Cloughmill has double the numbers of the state school so not sure about that theory.
LikeLike
The rise in numbers in Ballymoney is indeed an overspill into cheaper, good quality housing in comparison to the Coleraine and Ports area from the north and to a lesser extent, Ballymena to the south.
LikeLike
I can understand people wanting to living on the coast but are prices in Coleraine itself really that prohibitive? I find this odd. What could be driving this – people moving in from Derry and Limavady?
LikeLike
Off my head, i was projecting the Catholic pop to incease to over 900, instead it has remained static in Clogh Mills, while the Protestant/no religion Unionist community has increased. On a phone so not going to look up the exact figures for 2001 or 2011, but if I recollect correctly was Willie McCrea not warning loyal ‘Ulsterfolk’ around 1998 of the impending disaster looming if their birthrate didn’t increase and Clogh Mills is Davy Tweed similiar ‘nutter’ loyalist country, hardline, creationist loyalism. So maybe I’m wrong but I’d say there were alot of political sermons about demographics in those Gospel Halls going on, possibly with alot of quotes from UlstersDoomed and BangorDub to go with passages from the Bible with increasing progeny.
LikeLike
I’d be sceptical of the Prod breeding-program theory (as I would be of the Catholic one). It’s likely new housing in Dunloy and Rasharkin has attracted first-time buyers from the surrounding countryside, while older Protestants are drifting out of these areas into places like Cloghmills and Finvoy. Differential emigration rates would also play a part.
LikeLike
Of course the Catholic population of Ballymena has also been rising as people move in from the sticks.
LikeLike
Has anyone noticed the Green belt through the Bible Belt? I have mentioned it before and I am going to mention it again as it is an important development. The real Scots Irish, the people of the Glens, and the Gaels of Mid Ulster have formed a land bridge though the middle of the lallanders, from the Glens over through Loughgiel, Dunloy and on into Derry. Coleraine is starting to become an enclave, a big enclave but an enclave none the less. Also look at the increase of Catholics into Stranocum and Dervock. Is this Ballycastle nationalists overspilling into the area?
As for Glenarm. Remember that the only Primary school there is Catholic, the state school has been closed for a number of years now. But perhaps I will hold fire for East Antrim.
LikeLike
I was hoping to see that belt form fully but it seems to be suffering a setback with % C decreases in Dunloy, Cloughmills, Ballyhoe & Corkey and Killoquin Lower. It may be too much to expect C increased % in this area, in the face of unemployment/ emigration and the continued movement of Protestants from West to East.
Also, it requires rural demographic change as well as just in the villages. A few years ago Dallat was complaining that Ps wouldn’t sell their farms to C’s on the other side of the Bann and I think some measures were suggested relating to Estate Agents to counter this. Not sure if it’s still a problem there. Assume the same applies around Rasharkin/Dunloy. Planning bans on single rural dwellings also preserve rural status quo.
If the Loyal women are indeed propogating for Ulster, it may ultimately be futile as when these extra kids turn 18, they’ll be gone as there still be only room for 1 butchers apprentice on the main st etc.
LikeLike
Has it not always been the mission of the Orange Order to stop Protestants selling land to the enemy? I don’t see any reason this ‘tradition’ would end.
What’s clear is that there has been a Protestant drift into parts of Ballymoney borough – from Coleraine and possibly further afield. There has also been further dilineation of sectarian boundaries within the borough.
I think you’re reading too much into the Catholic ‘drop’ in places like Dunloy or Loughiel. It’s most likely people not filling in their census forms.
LikeLike
Fear F
With OO membership dwindling you would expect economic interest would take pole position. – I suppose farmers are more consevative than most and the ‘Tradition’ and mebership probably remains quite strong there.
Other than Coleraine Ps moving to P Ballymoney and P wards adjacent to the North of the Town, do you see stronger delineation in other areas?
LikeLike
There was a time when Dunloy was seldom out of the news. Now it’s Rasharkin. OO is strong (and v agressive) in north Antrim.
LikeLike
Croitear,
I noted your theory in an earlier thread and undoubtedly you have a point. It’s early days but certainly one to watch
LikeLike
BD
Are those 2011 Council figures for the Bann Valley District?
In a 6 seater, each quota is 1/7th + 1 vote ie: 14.3 %. 2 seats require 28.6 % and 3 requires 42.9 %. The combined Nat vote is 41.6 % and the have 1/3rd of the seats so they are under-represented.
Had they re-taken the 3rd seat, then with 50% of seats they would be over-represented – but alas they didn’t quite make it.
LikeLike
Paul G,
Yes Bann Valley. A mistake on my part. Guilty as charged. The full council figures are:
8 DUP
3 SF
2 UUP
1 TUV
1 SDLP
1 Independent.(Iain McAfee, (Ind) 347) Broadly Unionist but with an interesting history:http://www.bbc.co.uk/news/uk-northern-ireland-15278623
LikeLike
Cld I request you do Derry next?
LikeLike
Good idea!
LikeLike
Fear….Seconded ! Let’s see whend Sinn Fein are eventually gonna take Derry 🙂
LikeLike