

By Faha
The District Council elections are over and now it is on to the European Parliament elections scheduled for May 23rd. These elections were not even on the calendar a month ago for the UK but the unexpected 6 month delay (or longer) for Brexit has forced the UK to hold European Parliamentary elections.
What will be the results of the Euro elections in Northern Ireland?
For the District Council elections there were no opinion polls so it was a challenge to predict the outcome. This is not the case with the Euro elections. Lucid Talk conducted a Euro election opinion poll this week (more on this later). However, there was one other opinion poll this month and this was the District Council election.
The sample for this “opinion poll” was 676,867 and should provide an accurate assessment on what the Euro election vote will be.
In 2014 the District Council election and Euro election were held on the same day.
However, the results indicate that not all the same voters voted in both elections. These were the results.
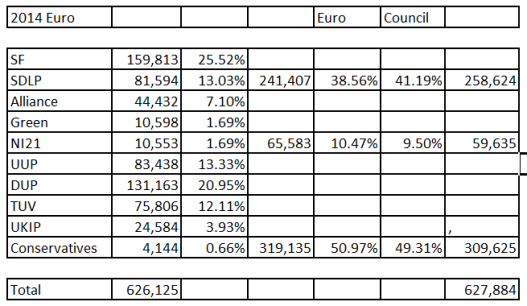
You will notice the vote is identical in both elections.
They do not appear to be exactly the same voters though. You will notice that the nationalist vote in the Euro election was 17,000 less than the council election. How could this be? Well, there were over 20,000 nationalist voters in the council elections who did not vote for SF or the SDLP and thus did not have a candidate of their 1st preference to vote for.
Many of these were PBP or dissident republican voters. Approximately ¼ did vote for SF or the SDLP. Another ¼ voted for Alliance-Green-NI21, which is why the Alliance-Green-NI21 vote was 6,000 higher in the Euro election. The other ½ (~11,000) did not vote in the Euro election.
For unionist voters it was the opposite.
There were over 100,000 TUV, UKIP and Conservative voters in the Euro election but only 40,000 from those parties in the council election. Jim Allister may have attracted some of those extra 60,000 voters but it is likely that 30,000 to 40,000 of them had no candidate of their preferred party to vote for in the council election. Apparently 10,000 of those did not vote in the council election but did vote in the Euro election because they had the option of voting TUV-UKIP-Conservative in the Euro election, which they did not have in the council election. When all the votes and transfers were accounted for the UUP defeated the SDLP for the 3rd seat by 43,000 votes.
In 2019 the Euro election is not on the same date as the District Council election. Nevertheless, the council election should predict the outcome of the Euro election since it will be likely all the same voters. What do the results of the 2019 election tell us compared to 2014?
2019 2014 Change
SF 158,579 23.4% 151,258 7,321
SDLP 80,379 11.9% 85,603 -5,224
Aontu 7,459 1.1% 0 7,459
PBP 9,478 1.4% 1,963 7,555
Ind Nationalist 25,457 3.8% 19,800 5,617
Total Nationalist 281,352 41.6% 258,624 22,728
Alliance 77,644 11.5% 41,786 35,858
Green 14,284 2.1% 6,354 7,930
NI21 0 11,495 -11,495
UUP 94,381 13.9% 101,375 -6,994
DUP 161,061 23.8% 144,886 16,175
TUV 17,586 2.6% 28,161 -10,575
PUP 5,338 0.8% 12,553 -7,215
UKIP 2,925 0.4% 9,313 -6,338
Conservative 1,876 0.3% 2,527 -651
Ind unionist 17,000 2.5% 10,810 6,190
Total Unionist 300,167 44.3% 309,625 -9,458
2019 2014 Change
Total Nationalist 41.6% 41.2% +0.4%
Total Unionist 44.3% 49.3% -5.0%
Total Nonsectarian 14.1% 9.5% +4.6%
There were 49,000 more voters in the 2019 election compared to 2014. There were 64,000 new voters added to the electoral register since 2014 so the majority of the additional voters were new voters though some were those who did not vote in 2014. It appears that most were nationalist or Alliance-Green voters. The total unionist vote was down by 9,458 and the nationalist vote up by 22,728. The increase in the Alliance-Green vote was 43,788 or almost twice the increase in the nationalist vote. The increase in the Alliance-Green vote came from 4 sources. Probably ¼ were NI21 voters from 2014. Another ¼ would be unionist voters who defected to Alliance-Green which is why the unionist vote was down. The other ½ would be a mixture of new voters and nationalist voters who switched to Alliance-Green.
Within the nationalist vote the SDLP vote was down but this was mainly due to the votes received by the 8 former SDLP councilors who were independents or Aontu in 2019. Thus, the other non SDLP origin independent nationalist vote was unchanged. The increase in the nationalist vote was equally shared by SF, Aontu and PBP.
Among unionist parties the vote was down for all parties except the DUP. There are several reasons for the changes. The UUP decline would be moderate unionists who defected to Alliance-Green probably due to Brexit. The DUP vote was up but some of that increase was due to the fact that the minor unionist parties had fewer candidates and some of those voters in certain DEA’s choose the DUP instead. However, there was a real underlying shift to the DUP from the minor unionist parties.
There was a marked 5% decrease in the overall unionist vote since 2014. The nationalist vote was only up slightly so the 4.6% increase in the Alliance-Green came more from new voters and nationalist voters.
So what are the implications for the Euro election? To begin with the Euro election is an election throughout all of Northern Ireland and a voter has a choice of a candidate from the party of their 1st preference. The council elections on based on the DEA’s and voters sometimes cannot vote for the party of their 1st preference because there may be no candidate standing from that party. Some minor adjustments need to be made in order to make a more accurate Euro forecast.
The unionist parties had at least one unionist candidate in all except 3 DEA’s and those 3 had minimal potential unionist votes. Alliance-Green had no candidates in 9 DEA’s and I estimate based on previous elections in those DEA’s that if they did have candidates the overall nationalist vote would be 0.2% less and the unionist vote 0.1% less.
SF did not contest 14 DEA’s and the SDLP did not contest 18 DEA’s. In particular, there was a significant SDLP vote in some of those DEA’s in the past and those voters most likely voted Alliance-Green or SF (in 4 of the DEA’s). All the adjustments would increase the nationalist vote by 0.6% and the unionist would be unchanged. The Alliance-Green vote would be down 0.6%. If the same voters vote in the Euro election then one would expect the vote to be:
Nationalist 42.25%
Unionist 44.25%
Nonsectarian 13.5%
The total unionist 1st preference vote will probably be 44%. The combined TUV-UKIP-Conservative vote in 2019 was only half of what it was in 2014 so I expect a corresponding decline for those parties in the Euro election.
Jim Allister was in a stronger position in 2014 because he could attack the DUP for sharing power with SF in Stormont. He can no longer do so since the DUP refuses to back the return of Stormont.
The DUP are also strongly pro-Brexit and that is their position in Westminster so he will be in a weaker position in 2019.
The UKIP candidate Robert Hill received only 154 votes in the Macedon DEA last week so this does not bode well for UKIP. The TUV, UKIP and Conservatives polled almost 1/3 of the total unionist vote in 2014.
I expect the unionist 1st preference vote to be:
UUP 14%
DUP 23%
TUV-UKIP-Conservative 7%
Based on the 2014 transfer pattern, 1% of the 7% from the smaller parties will not transfer. In 2014 the unionist vote that did transfer went equally to the DUP and UUP. So the unionist vote after the smaller unionist parties are eliminated would be:
UUP 17%
DUP 26%
Among nationalist parties it is a little more complicated because 6.25% of the vote in the council elections went to non SDLP non SF nationalists. A small number of the 1.4% PBP will actually go to Alliance-Green.
Aontu will definitely not go to pro-choice parties such as Alliance Green. The 3.76% independent nationalist vote is mainly former SDLP or SF candidates so few will end up with Alliance-Green 1st preference. The SDLP will be a little higher due to voters who could not vote for them in those 18 DEA’s with no SDLP candidate. They will also pick up some of the independent nationalist vote, mainly those of SDLP origin.
I expect the total nationalist 1st preference vote to be 41.5% with 0.75% of the original 42.25% lost to Alliance-Green.
SF 27%
SDLP 14.5%
For the nonsectarian candidates it could be approximately
Alliance 11%
Green 2.5%
Independents 1%
The SDLP is only slightly ahead of Alliance and based on the transfer pattern in this month’s council election and 2014, the 3.5% for Green and independents would transfer:
1.75% Alliance
0.75% SDLP
0.50% UUP
0.5% non-transferable
So the vote prior to taking into account the transfer of SF and DUP surpluses would be:
SF 27%
SDLP 15.25%
Alliance 12.75%
UUP 17.50%
DUP 26%
In 2014, 98% of the DUP surplus went to the UUP. The SF surplus was 20% non-transferable with approximately 65% eventually SDLP and 15% Alliance. So after they are distributed:
SF 25%
SDLP 16.5%
Alliance 13%
UUP 18.5%
DUP 25%
At this point Alliance would be eliminated. In 2014 Anna Lo of Alliance had a transfer pattern of 20% to unionist parties, 45% to the SDLP and 35% non-transferable.
I do not expect that there will be more than 20% of Alliance transfers to the UUP in 2019. There was a low rate of Alliance transfers to unionist parties in the council election this month and most Alliance voters are opposed to Brexit. The question is will Alliance have a 35% non-transferable rate in 2019? I believe it is unlikely with the prominence of Brexit in this election. The Alliance non transfer rate was very low in the council elections last week. So I expect that at most 2.5% of the 13% Alliance vote will transfer to the UUP, similar to 2014. The transfer rate to the SDLP would be 6% based on the 2014 pattern but likely 8.5% or higher this year. The final vote would be based on the original 100% of the vote:
SF 25%
SDLP 25%
UUP 21%
DUP 25%
Thus this Euro election will elect 1 SF 1 SDLP and 1 UUP. The 1st preference unionist vote was only 44.3% in the council election last week. Some votes are always lost in transfer. There will be few Alliance-Green transfers available to the UUP based on the transfer pattern observed in last week’s council election.
The LucidTalk presents a slightly different picture. This poll was conducted immediately following the council elections. The unweighted results in the poll were:
SF 24.6%
SDLP 11.8%
Alliance 10.2%
Green 4.1%
Jane Morrice 1.3%
Neill McCann 0.1%
UUP 10.6%
DUP 18.2%
TUV 7.7%
UKIP 1.5%
Conservative 0.1%
Undecided (will vote) 6.7%
Non Voters 3.1%
After the Undecided and probable nonvoters were removed the adjusted results are:
SF 27.2%
SDLP 13.1%
Alliance 11.3%
Green 4.6%
Jane Morrice 1.4%
Neill McCann 0.1%
UUP 11.8%
DUP 20.2%
TUV 8.5%
UKIP 1.7%
Conservative 0.1%
The Green preference is much higher than the 2.1% they receive in the council election. The TUV vote is also much higher than the 2.6% in the council election The increased TUV vote appears to be coming from council voters from the PUP, independent unionists and DUP as they is no absolute increase in the total unionist percentage. This may be related to Jim Allister’s high profile. It is not clear where the Green increase is coming from since there is no corresponding decline in the Alliance percentage. The poll shows a vote of 17.4% for non-sectarian candidates which is almost 4% higher than the actual council election results. The margin of error in the poll is +/- 2.6% so the real Green vote could be as low as the 2.1% in the council election. An interesting finding is the percentage of Undecided based on Constitutional Position which was:
Neutral 14%
Slightly nationalist 12%
Slightly unionist 10%
Strongly nationalist 4%
Strongly unionist 5%
The strongly nationalist group as a whole give SF 72% and the strongly unionist give DUP-TUV-UKIP 68%. The undecided within these 2 groups are probably undecided among candidates within their respective communities. The undecided among the slightly unionist and slightly nationalist groups give slight pluralities to the UUP and SDLP respectively. Since the percentage undecided is much lower among the strongly unionist and strongly nationalist groups the adjusted totals may be underestimating slightly the percentage for the SDLP, UUP, Alliance and Green candidates.
Second preferences for all candidates were asked and these are some of the results:
ALLIANCE VOTES
Green 47.8%
Morrice 6.0%
SDLP 25.0%
SF 9.5%
UUP 7.4%
DUP 0.6%
None 3.6%
This is a significant change from 2014. 35% of Alliance votes did not transfer to anyone in the final count and it appears this will be much lower this year. 20% of transfers went to unionist candidates in 2014 versus 8.0% this year.
Indeed SF would receive more transfers than all the unionist candidates combined.
Green Votes
Alliance 71.3%
Morrice 6.3%
SF 9.8%
SDLP 5.6%
Unionist 3.5%
None 2.8%
Alliance receive a large majority of Green transfers.
SF VOTES
Alliance 42.0%
Green 14.5%
Morrice 1.3%
SDLP 23.9%
None 17.6%
SF voters are more than twice as likely to transfer to Alliance-Green rather than the SDLP.
SDLP VOTES
SF 11.4%
Alliance 71.8%
Green 8.1%
Morrice 4.7%
None 2.7%
Very few SDLP voters are willing to give SF a 2nd preference.
Now I should point out that the actual council election did not confirm these findings for SF and SDLP transfers. There were only a small number of DEA’s where a SF candidate had to choose between the SDLP or Alliance-Green and a similar small number where the SDLP had to choose between SF and Alliance-Green.
In the Oldpark DEA the SDLP surplus transferred 210 to Alliance-Green and 623 to SF so ¾ of SDLP voters preferred SF to Alliance-Green. In Omagh DEA there were near equal transfers to SF and Alliance.
For SF transfers in Lisnasharragh DEA almost ¾ transferred to the SDLP and ¼ to Green. In Bann DEA 89% transferred to the SDLP and 11% Alliance. In Causeway DEA 85% transferred to the SDLP and 15% to Alliance.
If the transfer patterns in shown this poll did occur in this election this would be the results after surpluses are distributed from SF and the DUP
DUP 25%
UUP 16.5%
SF 25%
SDLP 14.5%
Alliance 16.5%
Nontransferable 2.5%
Alliance would easily win as they would receive at least 10% of the SDLP total in transfers and would be over a quota. If for some reason the UUP and SDLP percentages were reversed then Alliance would win on UUP transfers though under quota.
Whether the council elections are more accurate or the LucidTalk poll is more accurate there will only be one unionist candidate elected- the DUP. SF will win a seat and the 3rd can only be Alliance or the SDLP. The total unionist vote will only be in the 42% to 44% range and both the council elections and LucidTalk indicate that few nonsectarian voters are willing to transfer to the UUP or any unionist candidate.

as always I am most impressed by Faha’s grasp of figures and projections
LikeLike
Faha called it right
NI sent a tricolour to brussels
LikeLike
Excellent/Thar bharr, mar is gnáth
LikeLike
Yeah, that’s pretty much the state of it. Nice bit of work.
There are are a few pockets of old school APNI/UUP voters out there – Holywood & Clandeboye DEA of Ards/North Down council where AP will transfer on to UUP. But as the recent elections and polls now show this old order has broken down almost entirely. It is now the DUP/UUP and Unionist parties in general that are transfer repellent. Wasn’t that long ago the hills range out with opinion pieces of SF’s transfer repellence problem. Did notice the media outlets were entirely uninterested in any vote beyond FPV totals.
The only event I can conjure that might derail your prediction is a surge in turnout. With Brexit what it is, the possibility exists of an Assembly/WM level of turnout. In that scenario I’d expect something like 2:1 Remain:Leave differential in the additional turnout. Which could be an even more disastrous outcome for Unionism.
After this election Unionism will have received less than 50% of the vote in three successive elections. The APNI/GP vote is greater than the gap between Unionist & Nationalist. While I am more conservative than Faha in how I think they will break down (50% Nationalist, 25% Unionist, 25% Don’t Know or Won’t Vote) it is clear that Unionism has alienated enough of these voters to be doubtful of winning a border poll.
Now add in what’s ahead of us: Stormont revival talks failure. Marching season. The next Brexit deadline. RHI report. Amnesty for military. The continual output of research, journalism and documentaries on UK’s role in the conflict. And Stormont still shut down over ILA & Rights.
Unionism is beset on many sides by forces which strengthen the DUP which simultaneously erode the overall Unionist voter base. The dominant Unionist voice is incentivized to continue its strategy of cannibalizing Unionism, accelerating the demise of the very Union it exists to defend.
Great analysis and thanks.
LikeLiked by 1 person
A lot of postals and proxies were not applied for in time.I think SF will be below 25% on the first count.
LikeLike
here are a few reasons why SF did so badly in irish local and EU elections
LikeLike
Fascinating analysis and predictions Faha,
I had assumed that only by Alliance getting ahead of the SDLP and getting their transfers, while keeping their own Protestant unionist votes safely away from the UUP, could the UUP seat be taken.
You suggest the SDLP could in fact take it. I suppose the Brexit factor is key in making it different from their previous attempts.
Do SF believe that, if they are recommending 2nd prefs to Alliance, or is that simply a desire to stop them getting up out of their electoral coffin.
Can i suggest ‘Border Neutral Parties’ as a less politically loaded and more accurate term that ‘Non Sectarian Parties’, which reinforces the UK political and media narrative that the NI tragedy is not of their making and is instead, down to Orange Paddy and Green Paddy, not being civilised enough to negotiate.
LikeLiked by 1 person
I always preferred non Unionist parties.
Your either a Unionist or you ain’t in the Failed State.
Is there any record of a full paid up marching Orangeman or Woman being an elected Alliance Party politician?
LikeLike
Thanks Faha,
You made a point here well that I’ve been making elsewhere. The crucial takeaway is the discrepancy between actual SF No.2 votes in the council election where a surplus or elimination transfer to both was available and what these people decided they would tell pollsters.
If the pollsters are right Alliance has the seat thanks in part to SF preferring them to the SDLP.
If the council elections (actual votes in boxes) transfers are repeated then the SDLP on these numbers will stay ahead of Alliance and win on transfers.
We’ll only know for sure how things pan out next week, but in the meantime this blog could do worse than advise a tactical 1st preference to get both elected. I know this blog is followed primarily by SF supporters and this will fall on deaf ears, but to everyone else, in the event that these 2nd preference patterns are true, it’s best to not let it get to that stage and just give Eastwood a number 1 (obviously full value), safe in the knowledge SF will be over the quota with 1000s to spare; rather than wait for not only fractional value transfer votes, but Naomi-preferenced transfers.
If the surplus pool was redirected to Eastwood initially, he’d be a near cert to win.
Having said that Danny Kennedy is having such a ‘mare I wouldn’t be surprised if another slice of his support has just peeled off in both alliance and TUV directions as he can’t make up his mind on Brexit. From Eastwoods point of view, he actually needs Danny to not completely implode. If for some reason he finished below Long her transfers would definitely lift her above Eastwood. The current party polling if replicated would just about suit Eastwood. Having said that I do think he has a little extra support out there that went elsewhere in the council, and he has performed pretty well in debates, probably better than Naomi last night. He may yet threaten 15%, in which case I’d make him firm favourite in any transfer scenario.
LikeLiked by 1 person
Great analysis Faha, the 3rd seat is really in play.
The SDLP are not being helped by SF here – it’s really interesting on Slugger seeing activists like Robin claiming that Eastwood is a non nationalist and so Vote Long 2.
Not sure this helps the overall nationalist cause – reminds me of various left wing splinter parties in the south claiming their rivals are not sufficiently socialist enough despite having similar messages.
On the Unionist side I fully expect TUV to poll stronger and the intra unionist transfers to be better, they are doing a decent job of making this about a 2nd “unionist” seat rather than a 2nd “no deal” seat.
LikeLike
Let’s hope that Sinn Fein’s move to stymie Eastwood, will sufficiently wind up all of the lapsed SDLP voters to get off their elderly arses and grab their zimmer frames and shuffle off down to the polling station on Thursday!
Failing that, I’d be reasonably happy if Long takes out the pointless UUP.
LikeLike
Seamus Mallon didn’t help Eastwood’s MEP bid by coming clean as crypto Unionist.
Like the Catholic Church who have repeatedly sold out the Irish people, many in the upper echelons of the SDLP have conspired with the authorities to keep the Nationalist people in their subservient place.
And like others who have collaborated with the British State to maintain Orange dominance (pick any Independent Newspapers hack), the threat of Loyalist violence is again put forward as the excuse for Nationalists to be denied their democratic rights by the very people who have spent almost a lifetime supposedly abhorring the threat of violence for political ends.
Hypocritical, deceitful and patronising traitors to truth, justice and democracy.
LikeLiked by 1 person
I don’t know if Mallon’s intervention actually did make a difference. SF 2nd prefs are where we would expect to see the largest impact and we did not get to see those transfers. SDLP FPV’s were down 3k on 2014, where the DUP was down 6k, SF down 33k and UUP down 30k. All of which makes me think that Mallon’s position is well baked into the existing SDLP voter base.
LikeLike
Yes, but Mallon may well have deterred SF voters who were thinking about lending their FP vote to Eastwood to get him above Naomi and get 2 nationalists in, only to be reminded of the of the treacherous role some SDLP leaders played during the conflict. I mean, how do they excuse Gerry Fitt asking the RUC to keep blaming the IRA for the McGurks bar massacre, when they knew it was Loyalists (probably guided by Mi5)?
LikeLike
PaulG,
given the history (some of which you enumerated) how large is the cohort of SF voters that would lend their FPV to an SDLP candidate to begin with? If Mallon’s impact was limited to this group, then I think Mallon’s impact ranged from negligible to made no difference. Are there any surveys, polls or estimates out there that would give us a size estimate of this cohort?
Overall, I just think Mallon’s position is already baked into the electorate in NI, given the lengthy history.
LikeLike
I don’t think it will be possible to quantify the impact. However, the fact that one third of the nationalist vote shifted from the SDLP to SF since the ceasefires, suggests that there was ample scope for loaned votes.
In the south, SF have similarly just discovered that about a quarter of their 2014 vote are also ‘fluid’ and happy to move around the liberal lefty parties.
Obviously, terrible timing to lose part of their core vote to Aontu at the same moment they find out their new friends have moved on to the next fad.
LikeLike
Aye, impossible to definitively know but to each his reading of the tea leaves.
I wouldn’t say the Nationalist vote was “loaned” to SF, one election would be a loan, this was a 20 year slide. Under Mallon the SDLP was perceived by the N community to be rollover Nationalism and that drove the switch to SF. In 2019 I’d say it was the APNI that has been loaned votes, and they have one electoral cycle to accomplish something with that loan before it is called in.
After the GFA, when SF started rising in the polls. UUP, DUP, SDLP all started insisting it was due to ballot box stuffing and other criminal activities to subvert the election. So they had the UK govt pass more stringent requirements on registering to vote. The electorate fell by about 100k but at the next election but it was the UUP & SDLP who saw their vote slump, not SF.
I would really like to see some polling on the issue but people whose opinions I generally respect are suggesting the Lyra McKee murder underpins much of SFs setbacks in the recent elections.
LikeLike
A bad day for unionism today but an equally bad day for nationalism. Again nationalists are presented with an open goal and manage to hit the corner flag. 36% of the vote won’t be getting a border poll anytime soon. As great as Naomi is colum is just as articulate and capable so don’t understand why nationalists have lent her so many votes when a second seat for nationalism was quite achievable. The in fighting that goes on at times is just ridiculous. I do think Seamus Mallon may need to be kept away from the media for a while before he does his own party any more damage the cretin.
LikeLiked by 1 person
1 DUP
1 Sinn Fein
1 Alliance
UUP loses MEP after holding seat for 40 years.
Times are a changing.
LikeLike
Interesting, this: http://www.irishnews.com/news/northernirelandnews/2019/05/28/news/boundary-commission-unfair-in-proposals-to-redraw-electoral-constituencies-court-rules-1629801/
Proposals for redrawing electoral constituencies in Northern Ireland unfairly failed to fully consider all consultation responses, a High Court judge ruled today.
Mr Justice McCloskey identified the legal flaw in the Boundary Commission for NI’s final recommendations.
He said: “Its decision making process was vitiated by procedural unfairness, as the common law right of all consultees to have their views considered fully and conscientiously and on the basis on a level playing field was frustrated.”
The verdict represents victory for a Belfast man who brought a judicial review challenge to the commission’s proposals.
Plans published last September will see the number of parliamentary seats cut from 18 to 17, as part of a wider move to reduce MPs at Westminister from 650 to 600.
But unlike earlier proposals which involved Belfast dropping to three constituencies, the city is to retain four seats under the final recommendations.
Lawyers for the man claimed the commission has acted unlawfully and unfairly.
Described as “a constituent affected by the changes to the electoral boundaries proposed by the Boundary Commission”, he was given anonymity in the case.
The planned constituency shake-up provoked political controversy, with Sinn Féin criticising changes they claim would leave a number of constituencies without any nationalist representation.
Central to the legal challenge is a rule within the relevant legislation which allows the commision to deviate from a 5% range of the UK electoral quota when considering constituency size.
Counsel for the man taking the case, argued that the authority had shifted away from its provisional recommendations by relying on the rule without a proper legal basis.
He claimed the commission had suddenly changed direction in a radical way.
Lawyers for the body under challenge insisted changes to the proposals were were in response to “a healthy and procedurally correct consultation process”.
However, Mr Justice McCloskey held that the commission had fettered its discretion by failing to fully consider consultation responses received in the final stage of the elaborate statutory process it had followed.
A further hearing next month will decide on the final remedies and order in the case.
LikeLike
My contribution to the consultation made specific reference to how the previous (2012) review made reference to me for proposing broader knock on changes and yet when I highlighted the broad changes in 2018 and referenced 2012 reticence to broader changes it obviously was ignored. Hope the court case quotes my submission as evidence.
LikeLike
Once again nationalism managed to miss an open goal, the have sent two unionist parties to Europe when they could have sent two nationalists. The Alliance party is a unionist party, it supports the status quo. It is the child of the pro O’Neill faction of the Unionist Party that merged with the Ulster Liberals. What a missed opportunity.
LikeLike
Anybody got any opinions on Fintan O’Tooles modest proposal that SF resign it’s seven seats at Westminster.
And let independent candidates endorsed by the pro remain parties in the North win the subsequent by-elections. They can then take the seats and block brexit
LikeLike
I think Fintan is trying to become the political equivalent of Heath Robinson
LikeLike
Brexit will probably cause the break up of the Union with NI and Scotland.
Why would SF renege on their promise to their voters, in order to save the UK, just because some of the D4 set and their journo mouthpieces are worried there won’t be as much in the Free State trough, as they’ve grown accustomed to.
They have no favours with Republicans, that they can call in.
Let Borris roll his dice and we’ll see if the Tories look after the interests of all those west Brits and crypto unionists who’ve guided southern opinion into swallowing the UK’s version of the conflict and betraying northern Nationalists.
Keep dreaming, Fintan.
LikeLike
https://amp.businessinsider.com/boris-johnson-wants-ireland-form-new-union-uk-after-brexit-2019-8
LikeLike
The Republic is a proper country with a proper economy.
It’s not going to be treated like the plaything of Tory fantasy, like some distant island possession to be bartered and discarded.
That unfortunately is the lot of NI. The Union has turned it into an economic basket case and now it will be humiliated further when the English decide to lose the Backstop and live with a border down the irish sea.
That was always the choice. Nothing can change it. But now that The Brexiteers have defined UK Independence as being contingent on removing the backstop, only one option remains for them.
Post election, the DUP will get royally shafted, in a way that they wish was still illegal !!
LikeLike
Protest against Boris’s suspension of Parliament
The full list protests is as follows:
Aberdeen, 12 noon at the Castlegate.
Birmingham, 1 pm on Victoria Square by the Council House.
Bournemouth, 11 am, Bournemouth Square.
Brighton, 12 noon, The Level BN1 4ZN.
Bristol, 12 noon, College Green.
Cambridge, 12 noon, outside The Guildhall, Market Square.
Dundee, 2 pm, City Square.
Exeter, 11 am, Bedford Square.
Glasgow, 2 pm, George Square.
Leeds, 11 am, Town Hall.
Liverpool, 12 noon, St George’s Hall.
London, 12 noon, Downing Street.
Leamington Spa, 12 noon in the Pump Room Gardens.
Manchester, 12 noon, Cathedral Gardens.
Newcastle, 12 noon, Grey’s Monument.
Norwich, 2 pm outside City Hall.
Nottingham, 11 am, Brian Clough Statue close to Old Market Square.
Oxford, 11 am, Broad Street outside Balliol College.
Plymouth, 11am, Armada Dial.
Southampton, 12 noon, Guildhall Square.
Sheffield, 11 am, Town Hall.
Swansea, 12 noon, Big Screen at Castle Square.
Swindon, 11 am, 29 Wood St.
Tavistock, 12:30, Lockyer House, Paddons Row PL19 0HF.
York, 11 am, St Helen’s
LikeLike
LucidTalk is conducting a poll this weekend. One of the main questions is a Border Poll and whether the voter prefers a United Ireland or to have Northern Ireland remain in the UK. Results should be available in 1 to 2 weeks.
LikeLike
https://www.independent.co.uk/news/uk/politics/boris-johnson-prorogue-parliament-brexit-dominic-cummings-email-court-scotland-a9089911.html
LikeLike
Meanwhile, this: https://www.belfasttelegraph.co.uk/news/northern-ireland/poll-51-of-northern-ireland-voters-back-united-ireland-according-to-lord-ashcroft-survey-38488280.html
LikeLike
You’ll be interested to know that Faha is preparing a blog on this very matter 😉
LikeLiked by 1 person