
As has been mentioned in the comments recently, the legendary Horseman’s predictions are gradually playing out in the real world and proving incredibly accurate. In that spirit what follows is Fahas analysis of the latest release of the schools census data.
If I may, I’d like to thank all those who take the time to comment here. That is the reason this blog keeps going. In addition we have many readers who don’t comment but the figures continue to amaze me. 1,600 a day on average is a very respectable readership.
Go raibh maith agat agus lá fhéile Pádraig sona dhaoibh
Bangordub
The data for the 2016 School Census was released recently. This data was obtained in October 2016 for all Primary, Secondary and Special Schools in Northern Ireland. These records are available as far back as 2000 so I have compiled and compared the data for that 17 year time period. Here is the yearly data for the question on religion for students in each year.
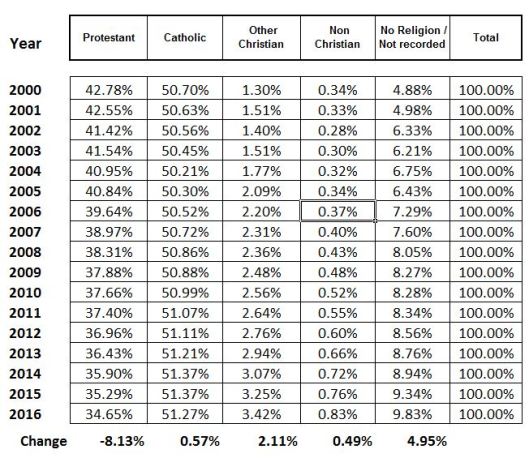
The obvious and main trend is the steady decline of the Protestants in the student age groups. The Catholic percentage has increased slightly over the 17 year time period. There has been a small increase in non-Christians and those with No Religion has doubled from 4.9% to 9.8% during that time period. There also has been a significant increase in the Other Christian group who now constitute 3.42% of all students.
Who are these Other Christians? In the looking at the detailed 2011 Census Religion information by denomination and accounting for the recent increase in Romanian and Bulgarian nationals it appears that approximately 0.5% are Eastern Orthodox (EU nationals). Of the remaining 2.9% it appears that 1.75% can be accounted for as non-denominational Protestants or other Christian related religions such as Mormons. That leaves 1.15% remaining. Of note is that while Other Christians are only 3.42% of the student population they make up 25% of students in integrated schools.
Many of these are probably children of mixed marriages and children of Protestant and Catholics who are not affiliated with a church or parish. I estimate that of the total 3.42% that 0.5% are Eastern Orthodox, 0.5% of Catholic background and 2.5% of Protestant background. In the school census there are also 9.83% with No Religion or Not Recorded. The 2011 census category for Religion Brought in did not have a Not Recorded category but comparing the two I estimate that most of the 9.83% (at least 9.0%) with No Religion Not Recorded are actually No Religion.
There are probably a small number of non-denominational Protestants. There are also a few Catholics who are Not Stated since they wish to not reveal their religion status in State schools in order to avoid potential harassment.
Taking all these factors into account I estimate the Catholic population at 52%, the Protestant population at 37.5%, Non-Christian or Eastern Orthodox at 1.25% and No Religion at 9.25%. The Protestant student population is declining at 0.4% per year and by 2021 will be only 35%.
That year will be the 100th anniversary of the founding of Northern Ireland. The irony in that 35% is that in 1921 that was the percentage of the Northern Ireland population that was Catholic.
All these students will eventually be voters and based on the recent Assembly election approximately 51% would vote for nationalist parties, 37% for unionist parties and 12% for non-sectarian parties. Every year from 2017 on will add a new voter cohort where there will be a 15% gap between nationalist and unionist parties.
The unionist parties do not appear to be aware of this large gap between nationalist and unionist votes that will occur into the future with no end in sight. The recent Assembly election may have alerted some unionists to this fact.

“51% would vote for nationalist parties, 37% for unionist parties and 12% for non-sectarian parties”
No way anything near 37% of Catholics vote for Unionist parties.
LikeLiked by 1 person
That’s not what’s been said in the quote..
LikeLiked by 1 person
It’s not only the birth rate that is determining change at the moment (although it is an important part of it) it’s also the deathrate. The Protestant Unionist population has a much older demographic and is almost 2 to 1 with people aged 65+. To put it crudely about 13,000 people die every year in the North, almost 9000 of these are from the Protestant community and over 40000 from the Catholic community. Whilst neither religion is politically exclusive, Protestants are still much more likely to be Unionist voters and Catholics nationalist voters.
Unionism is therefore potentially losing almost 5000 people per annum over and above Nationalism just through the difference in death rate (that’s a big chunk of an assembly seat quota every year) and these are older people who are more likely voters than any other demographic group.
Worse still there are two more decades left of higher Protestant Unionist numbers dying off before the death rate evens out. Potentially that’s a lot of votes lost to unionism which will feed increasingly through to election results alongside new younger potential voters being added to electoral registers.
LikeLiked by 1 person
One factor that is not accounted for is emigration. If there was no emigration of Northern Ireland natives the unionist electorate would decline only slowly. Data on emigration since 2011 indicates a yearly net outflow of 6,000 natives per year which is probably equally divided between Catholic, Protestant and Others. So the potential unionist electorate declines by 3,000 a year. The potential nationalist electorate increases by 3,000 less that it would otherwise. However, the difference is that there is a net increase of 1,500 immigrants from the Republic of Ireland yearly and these are all nationalist voters. There is also a net inflow of 2,000 Polish, 1,000 Lithuanian, 1,000 Portuguese and 3,000 other EU nationals yearly. How would these EU nationals vote in a Border Poll? For EU nationals a Border Poll is essentially a vote on whether to stay in the UK and leave the EU or a United Ireland within the EU. There will be very few EU nationals voting to leave the EU since they would be essentially voting for their own deportation.
LikeLiked by 1 person
Fair points William, re EU nationals, but surely non citizens will not have a vote in such a poll?
LikeLike
There’s possibly an argument to be made that emigration is higher from the Catholic side insofar as younger people are more likely to emigrate. Emigration stats in the 18-35 age group may be split evenly between Catholic, Protestant and Others but the greater proportion of Catholics in this age bracket would see a greater number of Catholics leaving, though ratios would stay the same. Difficult to say though, as the popular consensus appears to be that Protestants are more likely to head to the *cough* ‘mainland’ for University education (and are less likely to return?) I don’t know what stats are for current QUB students, but I believe there is a fairly hefty nationalist majority there. Though obviously not everyone goes to University…
I think it’s reasonably safe to say that Polish people are, on balance more likely to vote to join a UI – both from the point of view of preserving EU membership and also that they are more likely to move in CNR circles owing to Catholic background, children’s schoolfriends etc. The ‘no religion’ cohort tends to be seized upon by Unionism by claiming that ‘they’re Protestants really’ but that is likely just wishful thinking.
The other thing that doesn’t often get picked up on is that those of a child bearing age are now majority Catholic which has lead to the large disparities in the 0-10ish age brackets which will only increase. Again, this only goes to highlight the short termism of Unionist thinking, as ‘outreach’ attitudes continue to struggle to get out of the traps. Statistics aside, the stronger Irish culture becomes in the north the more appealing it becomes to younger people, hence why the cut in the Líofa bursary scheme proved to be such a massive own goal by Mr Given.
Excellent stuff as ever, Faha. Hopefully these blogs will get shared far and wide. Raising a glass to Horseman tonight.
LikeLike
Muiris,
EU nationals were eligible to vote in the 2014 Scottish independence referendum.
LikeLike
The net rate of decline will roughly double compared to this decade compared to the previous one due to more Unionist deaths as the population ages
LikeLike
Much the same information can be gleaned from the 2011 census, where religion by age cohort shows a plurality of Catholics from age bands 35-40 down, hovering about 45-46% for under 10s. (Only 25% of over 90s)..
The big growth designation is, however, the ‘no religion/not stated’ nearing 25% of under 10s.
LikeLiked by 1 person
In addition to the demoralising effects of losing their electoral majority, I suspect that hardliners in the Unionist community will become more and more alienated from their own statelet as the visibility of Catholics increases in the public service, in broadcasting, in business and in other walks of life. We’ve already seen that in the reaction to news that the public service in the North is changing apace (www.newsletter.co.uk/news/large-decline-in-protestant-representation-in-civil-service-1-7798919). How much of Unionist anger at the legal system is really about ‘imbalance’ in historical enquiries and how much about having to put up with a Director of Public Prosecutions called Barra McGrory? How much of Arlene’s truculence against the BBC is driven by a perception that it has too many Catholics working in it? It’s a perception usually framed in more subtle language (http://news.bbc.co.uk/2/hi/uk_news/northern_ireland/8328247.stm), but I think we all know what’s being said.
Some have asked, ‘Would the DUP be able to serve in an Executive if Sinn Féin were the biggest party?’ The question may be even more fundamental: ‘Will Unionists be able to tolerate a society in which Catholics and Nationalists will be more prominent simply by force of numbers? Or will they resort to violence?’
LikeLike
I have heard the threat of violence from Unionists in reports on a few occasions since AE17 results stunned some people. For those of us that keep informed, by this blog and others, it was no surprise. As described above and as predicted by Horseman, the writing was on the wall for years for all to see.
The only mild surprise was that Nationalists fronted in numbers and voted for nationalist parties. It proves that, if they are motivated, they will turn up at their local voting centre and exercise their ballot. The challenge for Nationalism is to keep UI on the agenda and to make it appealing to all including non Nationalists. In this respect, Brexit is a godsend.
The threat itself seems to elicit, in some anyway, a response of nothing can change until ALL Unionists are happy to join a UI. There’s democracy in action!!
LikeLiked by 1 person
Unionist anger and truculence in the unionist community about ‘too many’ Catholics being employed in the various public services is because one Catholic working in any of these bodies is one too many for their happiness.
LikeLike
Faha, love your work but could you not have focused a bit more on the nearly ten per cent of pupils who are ‘no religion’ – it seems pretty significant.
LikeLike
It is difficult to find information on that 9% of pupils who are “No Religion”. From other sources I estimate 2% are children of mixed Catholic-Protestant parents. Probably another 4% with Protestant background parents and 2% Catholic background parents. There is polling data for adults who are “No Religion” and approximately 25% vote nationalist, 35% to 40% Alliance-Green and 35% to 40% unionist. They are definitely more attracted to the non sectarian parties compared to Catholics and Protestants.
LikeLike
It just seems to me that a sig majority of people of no religion live in predominately unionist areas. Maybe some nats keeping their head down a bit? Would love to see that polling data.
LikeLike
The piece in Saturday’s newsletter also mentions this 10% and concludes that they are neither unionist or nationalist but may lean closer to nationalism over issues like Brexit. I agree will Niall more study of this growing 3rd group needs to be done and the nationalist parties need to appeal to them as well as liberal unionists to build as inclusive a coalition for unity as possible.
LikeLike
It would seem the Newsletter may have finally decided to alert its readers to the demographic situation they will shortly find themselves in.
The headline is predictably couched in some rather hysterical language, but the penny would appear to be dropping in some quarters. Or it could simply be scare tactics in the event of another election. Nevertheless, will this result in concerted efforts to stop the Orange Order tail wagging the Unionist dog? Is the Pope a Protestant?
There certainly seems to be something in the air, at any rate. Some interesting reflections here on Irishness from a Bangor Protestant –
http://www.independent.co.uk/news/long_reads/st-patricks-day-2017-ireland-united-troubles-republic-eu-membership-stormont-elections-northern-a7626971.html
LikeLike
Here’s the link to the Newsletter
http://www.newsletter.co.uk/news/catholic-population-set-to-dwarf-protestants-in-years-ahead-1-7872318
LikeLike
Digesting the 2017 election, on that turnout and in my estimation, it looks like 52% Unionist, 46% Nationalist and 2% on-the-fence.
Lucid Talk quarterly tracking poll has 8% U already jumping ship to UI/EU and 30% as potentials.
8% of 52% is a 4.2% swing yielding 50.2% UI 47.8% UK 2% up-for-grabs. Any of that 30% wavering only increases the margin of victory. Someone should tell the dissidents.
The negotiations on the return are rather weird and everyone seems to think that direct rule is an option. Surely the British govt renaging on the 2006 agreement to never, ever again reintroduce DR would trigger a crisis.
LikeLike
http://www.belfasttelegraph.co.uk/opinion/columnists/bill-white/assembly-election-2017-sinn-fein-always-the-winners-uup-always-going-to-be-hit-hardest-35562024.html
Bill White still talking about the bigger nationalist turnout. Common sense would indicate that nationalist turnout only returned to parity after a drop over the last 5-10 yrs but he talks about it as if there was a big differential, why?
LikeLike
http://m.belfasttelegraph.co.uk/news/uk/northern-ireland-could-rejoin-eu-if-it-votes-for-united-ireland-says-brexit-minister-david-davis-35571589.html
LikeLike
Stating the obvious – if the north rejoins the south it ipso facto joins the EU. The UK will cede the territory to Ireland,. It does not change any of Ireland’s treaties with any third party. It may lead to the EU wanting to change Ireland’s status but this would be more in the matter of how much the Irish pay into the EUU, may even make tem net beneficiaries again.
LikeLike
My impression is that the Tory government has little interest in keeping Northern Ireland within the UK when Brexit occurs. Look at the recent article in the UK polling Report on the Northern Ireland Assembly election. There were 633 comments and few of them were even related to the Northern Ireland election.There were more comments on Scottish elections and English bye elections. Most of those commenting seem to give the impression that Northern Ireland is a foreign country. With Northern Ireland gone the border will be the Irish Sea which certainly makes life easier for Theresa May. The loss of the unionist majority at Stormont has alerted the Tory government that eventually there is no long term future with Northern Ireland within the UK so they might as well get rid if it in 2019.
LikeLike
Faha,
re ” the Tory government has little interest in keeping Northern Ireland within the UK when Brexit occurs”
The demographics will wind on slowly -the British have no intention of jumping ship early – they want a quiet(ish) life – they have little interest strategic selfish etc in Norn Iron but they have a great disinterest in having an outbreak of civil strife when they are still holding the baby.
LikeLike
All these human-months grinding demographic and psephological data and patiently waiting for the glorious day.
And 1 billion barrels of oil is found off the Shetlands and the Scottish Parliament vote to hold another independence referendum.
At this point, unless May reneges on Brexit in 23 months and 3 weeks or Scotland is independent. Guaran-fecking-teed. It was the economic argument that scared just enough to vote No. With 1 billion barrels, that argument is DOA.
With Scotland gone, the knock on effect in NI is another 5% for UI (imo – id say humble but frankly after literally 20 years of excel spreadsheet gurning I’m feeling cocky (so that’s hubris and it comes right before a fall) and the Greeks notwithstanding I’m going spheres to the vertical).
Even w/o Scotland the LucidTalk numbers give us a 52% to 55% majority for re-unification, the UK dissolving removes any ambiguity or reasonable doubt whatsoever.
This needs to be done as fast as possible, if it is allowed to drag out the killing of civilians WILL spark another Troubles. Just look at the CAIN deaths for the years up to Bloody Sunday in 1972. It could have been put back in the bottle in the winter months when the murders stopped. But after Derry, the fires of rage were lit and became self sustaining. That is the true tragedy of The Troubles, that it could have been averted. So I do not understand why the Parachute Regiment, a frontline WW3 unit trained to deploy behind Russian lines in the event of an invasion of Western Europe, were doing policing civilians marching for civil rights.
But I do understand. It was done with malice of forethought. The civilians were murdered on purpose to draw the PIRA out so the superior training and numbers of the British Army could eliminate them from the battlefield. They thought they would fork them. Either the PIRA would fight and die, or slink away and lose support of the community and therefore be defeated. But neither of those eventualities transpired. Let there be no doubt whatsoever, the plan before the march was to murder civilians. That is what is celebrated by the poppy and the cenotaph each year.
LikeLike
http://www.express.co.uk/news/uk/785065/Ale
LikeLike
seen elsewhere….
http://www.judecollins.com/2017/03/brexit-irish-border-not-matter-british-national-security-interest-rather-matter-vital-irish-national-interest-sammy-mcnally/#comment-367013
LikeLike
If you took the stats from the last census, the mortality, fertility, immigration and emigration rates would it be possible to predict the current community sizes and say in 10 or 20 years?
I’m also curious as to the areas most likely to flip from Unionists to nationalist. Is there data on where to keep an eye on?
LikeLike
The Irish Times and The Detail have collaborated on a new mapping project relating to geographical/demographic patterns in the north, which is likely to be of interest to readers here –
http://www.thedetail.tv/articles/data-mapping-shows-northern-ireland-s-divisions-haven-t-gone-away
http://www.irishtimes.com/news/ireland/irish-news/two-tribes-a-divided-northern-ireland-1.3030921
Nothing that those who pay attention to such things don’t already know – I get a slight sense that this is all in part to offer Irish Times readers of South County Dublin and beyond a better understanding of that strange place an hour up the road. I wonder why that might be? Worth bearing in mind that these are working from the 2011 census, so things are likely to have progressed (at a faster rate?) since then.
Irish Unity is to be on the agenda like never before –
https://www.ft.com/content/7a48e040-0d67-11e7-b030-768954394623
http://www.theneweuropean.co.uk/top-stories/brexit_has_given_sinn_fein_new_grievance_to_awaken_old_cause_1_4957637
http://www.cbc.ca/beta/news/world/brexit-northern-ireland-don-duncan-1.4045368
LikeLike
http://www.thedetail.tv/articles/the-northern-irish-identity-is-no-new-dawn
LikeLike
This dude must be doing a watusi in his grave:
“I recommend those people who are Loyalists not to employ Roman Catholics, 99 per cent of whom are disloyal; I want you to remember one point in regard to the employment of people who are disloyal….You are disenfranchising yourselves in that way….You people who are employers have the ball at your feet. If you don’t act properly now before we know where we are we shall find ourselves in the minority instead of the majority.”
— Viscount Brookborough — second PM of Northern Ireland — in 1934.
LikeLike
https://2irelands2gether.com/2017/03/26/the-most-interesting-conversation-i-have-had-about-irish-unity-for-a-very-long-time/
LikeLike
Are we at the date yet that it is projected that Catholics outnumber Protestants in NI.? I remember estimates the time of the last census that this date would be sometime in 2016 or 2017.
LikeLike
Yes, Catholic population overtook Protestant on 30 January 2017.
Over 18 population has about a 48,200 gap which will be closed by January 2023.
All figures derived from Edna’s fine blog:
http://endgameinulster.blogspot.ie/2013/11/demographic-timebomb.html?m=1
If there’s another vote next month, the community gap will have reduced by about 1,500 in the time between the two elections. That’s about a quarter of an Assembly quota in 3 months.
LikeLike
General election to be called on June 8th.
LikeLike
Shame it isnt on the new boundaries!!!
Will be interesting to see if new UUP leader goes for a pact. If he does he is a dup poodle but if he doesnt then he loses both their seats. Will also be interesting to see if the good SF vote in South Down and Foyle holds up and threatens the SDLP seats.
Other than that dont see much change. Nationalist vote still too fragmented in North Belfast to stop Dodds but would love to see him beaten.
LikeLike
I’m not so sure about N Belfast. Having seen, so recently, that the DUP are a minority there, CNR voters may coalesce decisively.
LikeLike
North Belfast isn’t just that, it contains large Protestant districts outside North Belfast Rathcoole and Monkstown giving Nigel the advantage. Alongside a split opposition vote, Nigelcould win with 40% of the vote (SF, SDLP, All, PBP and WP all standing & taking votes off each other)
LikeLike
SDLP and SF battles in Foyle and Sth Down will be interesting given recent Assembly election results putting SF in pole position. Will tactical unionist votes come to the rescue? Sth Belfast will also be very interesting a genuine 4 way battle in which the DUP could win if the recent Assembly result were to be repeated – with just 20.8 % of the vote. I would expect SF to retake FSTyrone even if the SDLP run, Tom Elliot hasn’t done himself any favours flip flopping over Brexit and his comments re Irish Language Act.
On the UUP and DUP side, the UU are damned if they enter a pact and damned if they don’t. They will probably still lose FSTyrone even with a pact but will also lose more votes to Alliance. With no pact SAntrim is also very vulnerable, but worse the DUP will pin the blame on them if they lose out on any gains: Sth Belfast or worse lose either East Belfast (more likely) North Belfast seats (less likely)
LikeLike
I thought that the Assembly constituencies were based on Westminister boundaries, and the DUP got c. 32%, with UUP on <6%, in the recent Assembly election.
I know that many will hold their noses at voting Sinn Féin, just as (fewer) others will not vote DUP. I may be wrong ( that (nearly) happened once before), but I expect demographics to catch up with with Mr Dodds sooner ( I hope). Or later.
LikeLike
Above re North Belfast
(obviously to most reading this)
LikeLike
The total Unionist vote in North Belfast was 42.8 in March [DUP 32.1 UUP 5.8 Prog Un 4.9]
The total Nationalist vote was 46.9 [SF 29.4 SDLP 13.1 and PBP 3.8 & WP 0.6]
Alliance 8.4 & Green 1.7 made up most of the other 10.1
Nationalism has made advances not always evident in recent elections but significantly evident in this one, but Nigel Dodds will maximise the Unionist vote (he always does at Westminster) and he will get between 40 & 45 % of the vote.
Gerry Kelly an able experienced candidate can’t match that on these present boundaries and figures. Even if he puts the squeeze on the SDLP, PBP & WP (and that’s a big ask) he can’t get much more than 40%.
A new younger candidate, someone like Tierna Cunningham may be able to better this and would be more able to attract some other parties votes from Alliance & Green – especially from young people.
That would be a challenge and make this seat a lot more winnable from The DUP.
LikeLike
Thank you William. Your figures sound plausible, unfortunately. Of course, demographic change has continued since the Assembly Election. Probably not decisive though, this time 😕
LikeLike