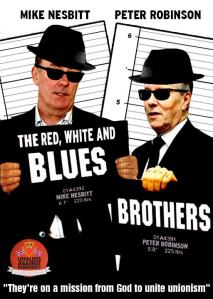
I’ve been busy this week workwise but events have been moving along rapidly. We’ve had Jamie “Biryani” Bryson released on bail after urging other unionists not  to accept bail. We’ve had Peter the great of Clontibret fame urging people not to support a local business despite being on a trip to promote local business and we’ve had TV Mike wanting to take over our, and I mean all of our, childrens education. As Jude Collins says, I wouldn’t trust him to mend a puncture. He’s even been on TV defending his disciplinary lack of action against a party member who dismissed a conviction for sexual assault as a “minor” matter. We even had our wonderful “pro consul”, Ms Villiers, on UTV last night making a point about how Michelle
 Gildernews O’Neill’s dept requested an RAF Chinook and how wonderful this was, to help distribute animal feed to the snow affected parts of the north. She conveniently forgot to mention this regarding the Irish Air Corps naturally. At least 3 blogs in there! Enough. The antics of the unionists parties have already descended from comedy into tragedy and are now pure farce.
Anyhow, onto Antrim……….
In 1981 there were 15 council seats in Antrim. 11 were shared between the DUP and UUP. The SDLP won 2, Alliance won 1 and the last seat went to an independent republican.
In 2011, with 19 seats on offer, the results were:
DUP: 5,210 (30.6%), 5 councillors
UUP: 3,391 (19.9%), 5 councillors
SF: 2,931 (17.2%), 4 councillors
SDLP: 2,806 (16.5%), 3 councillors
Alliance: 1,919 (11.3%), 2 councillors
The 2011 Census results show us how dramatically the demographics have changed over the past ten years.
2001 Census: 18,691 “Catholic” (38.64%); 26,970 “Protestant” (56.65%); 498 Other (0.45%); 2,055 None (4.25%)
2011 Census: 22.081 “Catholic” (41.20%); 27,401 “Protestant” (50.48%); 219 Other (0.93%); 3,950 None (7.39%)
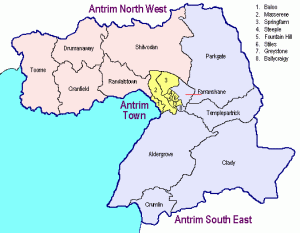
The combined unionist vote is very close to the protestant census percentage (0.2%) while the combined nationalist vote of 33.7% is considerably lower than the census figure of 41.2%. I believe this is a reflection of the younger age profile among catholics with the associated lower propensity to vote among the young and of course the fact that the under 18’s cannot vote at all. There is considerable evidence of an overflow of Belfast nationalists reflected in the statistics for places like Crumlin below. Aldergrove is astonishing but perhaps linked to closure of the RAF station there. Ballycraigy, Farranshane and Parkgate are all changing rapidly also. All of these form an arc south and east of the town. Is this the next rapidly changing DEA that invites an ulster unionist capitulation to the DUP?
| Catholic Change | Protestant Change | Catholic % 2011 | |
| 95AA01 Aldergrove | 10.4% | -14.5% | 33.4% |
| 95AA02 Balloo | -0.7% | -2.9% | 32.9% |
| 95AA03 Ballycraigy | 5.4% | -12.7% | 10.7% |
| 95AA04 Clady | 3.0% | -6.4% | 27.6% |
| 95AA05 Cranfield | 4.0% | -6.5% | 62.3% |
| 95AA06 Crumlin | 3.9% | -5.1% | 80.8% |
| 95AA07 Drumanaway | 1.7% | -4.6% | 15.7% |
| 95AA08 Farranshane | 4.6% | -10.3% | 44.6% |
| 95AA09 Fountain Hill | -1.5% | -4.2% | 22.1% |
| 95AA10 Greystone | 1.8% | -6.0% | 41.3% |
| 95AA11 Massereene | 0.0% | -5.9% | 38.9% |
| 95AA12 Parkgate | 3.0% | -5.1% | 7.1% |
| 95AA13 Randalstown | -1.1% | -1.4% | 69.0% |
| 95AA14 Shilvodan | 0.7% | -2.7% | 37.1% |
| 95AA15 Springfarm | -1.8% | -3.0% | 41.9% |
| 95AA16 Steeple | 1.8% | -7.7% | 19.0% |
| 95AA17 Stiles | -2.6% | -2.8% | 38.0% |
| 95AA18 Templepatrick | 2.0% | -5.4% | 14.0% |
| 95AA19 Toome | -4.0% | 2.6% | 89.7% |
| Totals | 1.6% | -5.5% | 38.2% |

Is it just me or have Toome and Templepatrick fallen out of Antrim?
LikeLike
Paul G,
Ouch. You are absolutely correct. Bad editing on my part and now corrected. Thank you.
LikeLike
We’ll let it go this once 🙂
LikeLike
Good to have you back, Dub. I was starting to thing you’d jacked it in!
I think the low nationalist vote in Antrim town is to do with a succession of fall-outs and feuds in the local SDLP, from which Alliance has been the main benefactor. Antrim town, though not devoid of sectarian tension, is in the main, pretty mixed.
LikeLike
Have to agree with that Fear. If you look at the transfers, they went proportionally for the SDLP way above and beyond the normal proportion. That, and Alliance had, at least, one ex-SDLP rep. on their ticket called Neil Kelly. Hopefully, they get their act together, and stop the infighting for next time. Shame that Grainne Teggart appears to have left the council too, presumably to concentrate on her position at amnesty international. She seemed to have promise.
Anyway, the barest of unionist majorities anywhere (1 seat) mirrored by the barest of protetsnat majorities (0.5%).
We often talk of councils moving from balanced to nationalist control; this one is moving from unionist to balanced control.
My particular interest n Antrim is, if these councils get one more turn at electing for the same areas, what with Armagh Council requiring about 50 more votes in the Armagh city ward to elect another nationalist to give the council a nationalist majority, and a couple of north belfast wards requiring just a couple 100 more votes to elect a couple more nationalists for an outright majority there would create a situation of 13 nationalist councils (including Belfast) to 13 unionist councils. However if Antrim elects one more nationalist (possibly 2nd SDLP in South east area) then the council goes into the balanced column and suddenly it’s 13 councils to 12….
LikeLike
I believe Oran Keenan, who stood for Alliance in Antrim town, was an SDLP councillor, as was Donovan McClelland who stood as an Independent. Shambles would not describe it.
LikeLike
The points about the SDLP are well made and all too accurate in my experience. There seems to be a lot of infighting or at least there has been
LikeLike
There seems to be a population shift away from the estates to the south and east of the town to new developments to the north and west. Springfarm ward is up 45% and Massereene is up almost 60% (even with closure of army base).
LikeLike
No significant change in the religious make-up in Springfarm and Messareene though. A similar mix must have come into Springfarm. If the Army base has closed in Massareene during this period, and the religious proportions are unchanged, then there must have been more P’s than C’s moved into those new estates.
The C % in Toome and Randalstown has surpisingly dropped. Is this due to a differential in non-responders being dumped in with the Atheists or a differential in emigration?
Sizeable increase in the C % in South East. The swing in Aldergrove is more than just the closure of RAF base. Nationalists really should be looking for another seat there, if they get the chance.
LikeLike
Paul,
The figures shown above indicate a decrease in the number of Protestants in Massereene and Springfarm.There are also a significant number of people in the No Religion Stated bracket in these wards, which is more than likely down to immigration.
The drop in Catholics in Toome is almost certainly due to non-respondents. With regard to Aldergrove, Crumlin has expanded into this ward, though so too has Dunadry. There is also an agricultural college, a mental hospital, a RAF helicopter base and a number of airport hotels.
LikeLike
Any info on proposed or started housing developments in Clady or Glenavy wards which could change demographics there.
A lot of petrol bombing etc in parts of Antrim town. There used to be a sectarian motive to a lot of it. Now it seems to be family feuds. Has the sectarian violence faded away in Antrim? Are those estates still mixed or were a lot of people forced to move?
LikeLike
Clady is very much a rural ward though it does now take in some of the outskirts of Crumlin. Gleanvy is of course part of Lisburn borough (though it’s South Antrim for Assembly and Westminister purposes). Note also that the western edges of Randalstown are in Cranfield ward (+4% C).
LikeLike
http://www.irishnews.com/business/-british-taxes-supporting-north-s-living-standards-1242462
LikeLike
I think it was Michelle O’Neill not Michelle Gildernew who asked for the helicopter.
LikeLike
Hoboroad, It was indeed, I must have been on the beer 🙂
LikeLike
Isn’t it nice to see the Irish Army Air Corps are offering theirs services to the Six Counties farmers free of charge. Unlike the RAF who are charging the Department of Agriculture for their help.
LikeLike
And not just helping the Farmers Hoboroad,
http://www.thejournal.ie/climbers-londonderry-849876-Mar2013/
LikeLike
“if [Scots] want more fiscal autonomy than you have at the present time, the only way to have it is through independence” Peter Robinson DUP
LikeLike
Here’s an article for the day that’s in it. The last few lines quoting Connolly are interesting:
http://www.philmacgiollabhain.ie/eiri-amach-na-casca-1916/#more-3642
LikeLike
Is Peter Robinson on his way out of politics?
http://t.co/ntiU58k1zx
LikeLike
And off to Miami? 😉
Can’t imagine the DUP opting for Arlene Foster if it came to pass. But she would be the smart choice. Popular in the party, more attractive to (conservative) female voters, and an easy sell to the media for a “modern” DUP and “modern” Unionism that some journo flag-wavers would like to see exist.
Would Donaldson be too tainted by former associations? Or could he successfully lead (and symbolise) a merge between DUP and UUP?
Dobbs might appeal to grassroots but he would turn-off voters in droves.
LikeLike
Interesting thought. I agree about Arlene but I cannot see the DUP electing a female leader. Equally I cannot see anybody other than her as a potential leader.
LikeLike
Too early for him but the most impressive Unionist politician (and the most impressive up and coming politician from either tribe) is Robbo v2.0 – Gavin.
Will probably be the leader after next.
LikeLike
He is promising but relatively untested.
LikeLike
So where to next on your voyage around the wee six, dub?
LikeLike
FF,
I was thinking Castlereagh, Pete’s little pet council, some interesting wards in there?
LikeLike
Bangordub
Thank you for your interesting blog.
When do you see the number of non unionist councillors in Northern Ireland going past the 50% of the 582 total.
Or put another way, when do you see the SDLP/SF bloc reaching parity numbers wise with the DUP/UUP with the Alliance holding the balance.
The SDLP/SF councillor total seems to have stalled between the 2005 LGD election and 2011.
LikeLike
PT,
Thanks. I think that would be an excellent theme for a new blogpost and I will start work on it ! Many of the comments here and individual constituency posts look at precisely that point. One of the problems with the “ghettoisation” of areas is that it stunts party growth which of course was it’s original purpose. Hopefully things are moving beyond that and I think the census results show that to be true. My next post will be on Castlereagh, an overwhelmingly unionist council with some surprising trends developing.
LikeLike
I suspect the stall is due to the disillusioned SDLP voters who couldn’t bring themselves to vote SF, staying at home instead. Now the proportion of Catholics who aren’t voting is similar to that of Protestants. Is easy to see why many urbane middle class Protestants wouldn’t want to be associated with the incompetent UUP or the sectarian antics of the DUP. Maybe if the the SDLP select a good leader for a change SF will get some proper competition and we may see the Nationalist turnout rise again – and with some demographic bonus’, a few more of those towers will topple
LikeLike
Hopefully over the next decade or so the demographic changes will topple some of the unionist ivory towers.
From a starting point of the 1970s i never thought one of the first to go would be South Belfast.
But then the more middle class areas don’t really do 50ft high peace walls.
That reminded me of the 1980s when it was said by some that nationalists would never get out the ghetto.
Well they do if they’ve got the money.
Who’d have thought capitalism might be an enemy of unionism.
Funny old world.
LikeLike