
I am grateful to Malkee for providing the following interactive map which details the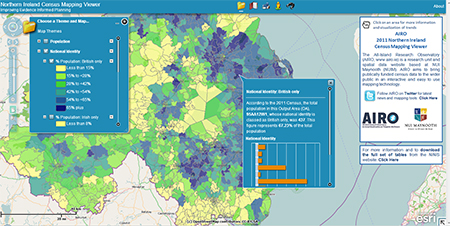 results of the 2011 Census. There is a fair bit of clicking, box ticking and filtering required but it is definitely worth the trouble. It has been produced by the All Island Research Observatory who I have to admit I’d never heard of! They are based at NUI Maynooth. Have fun with it…..
Lets get Interactive
20 Wednesday Feb 2013
Posted in Demographics

Great link and graphic. Did a Snagit and Photomerge of the the three “Nationalities”, British, Northern Irish and Irish. You can compare the spread side-by-side here on Flickr. Some things immediately obvious. “British” is very much an extreme north-east phenomenon.
LikeLike
Having had a long look at your pics, great work by the way, I am swinging solidly behind the view that at least 80% of the NI respondents are nationalist in background, Moyle is a good benchmark.
LikeLike
The geographical cross-over between “Irish” and “Northern Irish” is remarkably consistent. Certainly in and around the 80% mark as you state. If there is a section of the Nationalist community with a distinct “Northern” identity alongside a sort of background Irish identity it would hardly be surprising. Strong regional identities are common throughout Europe. If I was an SDLP strategist I’d be appealing to the Irish/N.Irish polity by shaping any reunification policies around the concept of continued regional autonomy within an All-Ireland state. That might have greater appeal to those of a Unionist “N.Irish” background too.
Might be a harder sell for SF though unless they shape it in a broader All-Ireland context (regional/provincial assemblies replacing county councils, with the northern one having a greater range of autonomy?).
LikeLike
Notice how they spell the word “protestant”. *Shakes head*
Regarding the map itself I expect the people north of the border to look at the ethnic/national data but if you guys can just tear yourselves away from that, a more important story is being told in the employment data. Check out some of the places West of the Bann such as deprived Strabane. Not sure if the nationalist SDLP people who frequent this site to worry about such matters but republicans and socialists do worry about that sort of thing.
Interesting also to see the large population drop in some deprived wards in Belfast.
LikeLike
The IRA ceasefire was predicated on ‘this sort of thing’
LikeLike
Factual,
Are you an official spokesperson for Sinn Fein?
I think you are suggesting that SDLP types are middle class and have no concern for “deprived wards” as you term them. I’ll let you in on a secret, If that was the case the SDLP would have died a long time ago. I happen to agree with FJH that nationalism is enriched by having a choice of parties. The advantage of nationalists is that we have no need of unity pacts. Thank God
LikeLike
Bangordub I must admit I was teasing.
It does though strike me that though people may be initially interested in the ethnic stats, one of the most important things on the interactive map, which is excellent by the way, is the unemployment figures, which tell an interesting story east v west.
LikeLike
I agree the unemployment figures are relevant but this particular blog is about demographic change rather than social and economic developments. The interesting thing I have noticed is how the centres of population, towns, cities and villages, are accelerating in their greening. Have a look at Ballymena for example
LikeLike
I couldn’t see how the table shows changes in anything other than totals?
LikeLike
Pick your preferred points in the left hand box, tick the filter boxes. Zoom into the area and click on the map, It’s tricky but persist and you’ll get it, I bet Feal Fearste has it down to a tee already 😉
LikeLike
I could get the 2011 levels that way, but not changes between 2001 and 2011 (except for anything other than population).
LikeLike
It is a 2011 map, not a comparison table or map. only 2011. Big Deep Breath. Factual, seriously, how old are you?
LikeLike
hi bangordub:
(1) The population totals *do* give comparisons with 2001. check it.
(2) You can’t say anything about *changes* in Ballymena with just 2011
LikeLike
Factual,
1. I made it clear which figures I was looking at, if you have an interpretation of the population figures please share them.
2. My Ballymena comparison comment was made because I DO have the 2001 figures and compared them quickly. I’ll publish in the morning as I need my leabha
LikeLike
Fantastic mapping tool. I’ve been playing name those enclaves!
LikeLike
Fear Feirsteach,
I reckoned you would, lol, I’ve been tweeting short strand about the area immediately around there, very interesting and very worrying for Peter R. I am sure you can see what I’m talking about in Ballymena and even good aul Bangor is fascinating
LikeLike
Factual,
As promised, the Ballymena figures show an increase in the catholic population of 5.2% while the protestant % declined by 7.8% since 2001
LikeLike
And yet you were keen to dispel the possibility of differential emigration when it was raised before! A constant of NI economics is higher unemployment / and higher emigration in mainly nationalist border areas. The problem is structural. The infrastructure still isn’t in place.
LikeLike
Fully agree with that statement. A lot of youngsters in my extended family have left Fermanagh, more are planning to go. It was always the case that any who left for uni did not come back although in recent times that changed, now though graduates plus those who go into work after school are leaving. Given the religious split in that age group most would be
bats(Nats- Bangordub). Quinns was a godsend and is now a looming disaster. Sad all round.LikeLike
Granularity is the name of the game. Same stats we’ve poured over before except with more detail and an interactive map. Nerd heaven. Kudos to those who put it together.
LikeLike
As noted on the previous westminster blog I think this map is great but the colours are giving me a headache why he couldnt have made it simple for all of us bigots and just had it as various shades of green and orange. Im also finding it difficult to tell what % are used for each colour as some wards with the same colour have massive differences in stats. One other thing on identity I cant see any stats for only British – Am I just being stupid or something?
LikeLike
Boondock,
I take your point about the colours used 😉
For British only, Tick the National Identity box and the British only box. Make sure there is nothing else ticked, eg Population box.
LikeLike
You have to look at the large numbers of Eastern Europeans who have moveed into Ballymena, E Belfast, Dungannon, Moy, Benburb, Derrylin, Newry, Magherafelt, Maghera, Armagh, Craigavon and Portadown before you can judge it as a greening of town centres.
LikeLike
I like that you can drill down to see where ward boundaries are in relation to roads and lakes etc. but the colour options with band options on the nisra site are better. These small Output areas are interesting and the data for 2001 is available at that level on the nisra site. It would be nice if somebody in NUI would input the 2001 data for comparison and then I’m sure it would only be a small step to producing a % map as well.
LikeLike
BD
I hope this map is not a substitute for further analysis of the census by council areas . Newtownabbey next? I was more interested in hearing what was happening in South Antrim with a Catholic corridor connecting the Nationalist Loughside wards to West Belfast. Big changes in Crumlin and Glenavy. Are loyalists still being allowed to force Catholics out of Stoneyford? What changes are projected in Aldergrove and Clady Wards? Are the poles moving into some of the Antrim Estates to work in Antrim or because people are leaving and there are empty houses ?
LikeLike
PaulG,
I’ll do Newtownabbey next 😉
LikeLike
Aldergrove has been effected by downsizing of RAF base.
LikeLike
The Output Area covering Belfast Internation Airport is showing a massive 37 % Atheists. That’s usually a sign of the presecence of a British military base. Have the RAF just moved the officers mess over to civi street or is that also a typical identifier for an Airport with multi-national staff etc?
LikeLike
Suppose you would have aircrews etc staying over at airport hotels
LikeLike
Is that link broken or is it me? Worked last night. Can’t get it to work at all right now.
LikeLike
It seems to be OK for me, if anyone else is having problems please let my know
LikeLike
Try this link
http://airomaps.nuim.ie/flexviewer/?config=NICensus2011.xml
LikeLike
It’s taking me to the map ok but not showing the overlays Dub. Seemed idiot proof last night. Can’t get anything now.
LikeLike
Otto,
Make sure all the boxes are unticked before you start
LikeLike
If you on religion and pick protestant some of the colour info does not match the associated output-area data. I found 3-4 examples of this.
LikeLike
Whoops! The data actually does match up. What is potentially misleading is theat the ‘Catholic’ map and the ‘Protestant’ map are colour-coded using slightly different percentile ranges, e.g. C uses 49> while P uses <52.
LikeLike
All,
I would dearly love to have to have access to mapping software, I don’t because I can’t afford it and it isn’t freely available. We have to make do with what we have I’m afraid. Believe me I’ve looked.
What we do have is local knowledge and a hub to discuss what is available out there. I’ll have N’abbey details out in the morning
LikeLike
Working again now.
Bangor West’s interesting but I know at least one family that would probably have called themselves only Irish where the Dad’s ex-RUC so don’t take too much for granted.
LikeLike
When did the CO data become available that has lead to this map?
LikeLike
Ormeau, It was released by NISRA at the end (30th) of January this year
LikeLike
Thanks Bangor dub but I can only ge dowb to the SOA level on the Nisra site. If you know of a link that would be great. Alos has anyone noticed how area have been put together like Bridgend is now linked in with the Short Strand when before it was an area to itself in the 2001 census
LikeLike
I believe I have found a genuine error this time. The population data for Blackstaff ward, Belfast is wrong – way wrong.
LikeLike
Fear Feirsteach,
From the NISRA figures for Blackstaff ward:
Total C P O N
3998 600 2859 73 466
LikeLike
That is the correct data. The interactive mapping tool gives the population of Blackstaff ward as 7412, which is wrong.
LikeLike
Cheers for that,
Perhaps they should have consulted us lot before rushing to publish, for a reasonable consideration of course 😉
LikeLike
Paul G,
The answer to your question about Stoneyford is that loyalists have succeeded in stopping Catholics moving in and to an extent have forced some families out. This is shown by the lack of rise in the Catholic population even though 100s of new houses have been built. They are up to the same trick at Magherlin were they put a massive UVF flag in a large building site on the Moira Road. Again they put large amount of flags in villages that are gaining new housing to try to prevent Catholics from moving in Dundrum, Moira, Drumbo, Glengormely to name but a view.
LikeLike
That is scary stuff Ormeau but I have to say is sounds true. My figures on Mallusk since 1991 tell their own story:
Total Catholic Protestant Other None
2011 8838 3724 3928 111 575
1991 4059 404 2451 581 623
This perhaps shows the dramatic change that can occur once catholics start moving in numbers into an area. It is instructive that Catholics seem to have
nolittle fear of expanding but protestants seem to move out once this occurs. Any thoughts on this?LikeLike
That’s not really what’s happening in Mallusk though. It’s large ward and there are a number of different residential areas in it. ‘Old’ Mallusk would still be predominantly Protestant. A lot of Protestants would also be moving into new developments along the Ballyhenry / Ballycraigy Roads.
LikeLike
Fear Feirsteach,
I’m not getting your point, in 20 years the population has more than doubled but the protestant population has actually fallen by 1500. Sorry but could you explain more? I’m not local to the area obviously
LikeLike
According to the stats you’ve presented above the P population of Mallusk has increased from 2451 to 3928.
LikeLike
Fear Feirsteach,
Hands up on that, you are correct. I’m blaming the half bottle of Red I’ve consumed since getting home. Nevertheless I think my point stands, if you look at the percentage increases?
LikeLike
I know you’re wondering so I’ve done some quick calcs:
Catholic Protestant Other None
2011 42.14% 44.44% 1.26% 6.51%
2009 9.95% 60.38% 14.31% 15.35%
LikeLike
The phenomenon you’re describing clearly exists. I just don’t think it particularly applies to that specific ward.
LikeLike
Thanks for that info Ormeau. I was very surprised that Dundrum would be subjected to those antics. Says a lot about the people in Clough. Don’t they know they’re already cut off and even the loyalist re-partitioners are leaving them on the Southern side of their fantasy border!
Incidentally, until last month I thought the smallest census area info available was Ward level. Now I see there small output areas which can be an eight or so of a ward in some cases. I have even found data for these small output areas for 2001 but their reference numbers don’t seem to match the 2011 references on this map. Were you able to match up 2001 and 2011 Stoneyford data? What is the missing link to tie these small output areas from 2001 to 2011?
LikeLike
Prods wanting to stick with prods is not unusual infact the BBC did a story on white flight from London in the last week. When you look at the fact that Prods only make up 29% of pre-school compared to a Catholic figure of 51% albeit in smaller survey numbers then you can see that this change will only accelerate in this coming generation.
A second factor is the rise of the Catholic Middle-class. These are the people buying houses in Moira, Ravenhill, Mallusk etc. On a positive note I dont think it has worked in Magherlin which has seen a large increase in the Catholic population around the GAA pitch. It has worked in Stoneyford and held up demographic change in places like Dundrum were a large Catholic community majority in the younger age-cohort in the DEA of over 80% has felt unsafe to move into the new housing being built in that village on a statistical basis and a couple of miles up the road in Seaforde the same tactic seems to have been used successfully.
LikeLike
The ‘white flight’ phenomenon – you beat me to it.
LikeLike
This is fascinating stuff.
Are you guys suggesting that when an area feels that nationalists are gaining even a foothold, the tactic is to up the tub thumping and coat trailing in an effort to reverse the trend? I ask genuinely. I’m only a blow in (6 years)
LikeLike
Part of ‘Norn Iron’ culture since the year dot. Sure it was old but it was beautiful…
LikeLike
Hasn’t exactly worked very well has it?
Maybe the “Pete and his pet” outreach project will work? Nah, that didn’t work out too well either. I won’t repeat here what my (S. Armagh) Dad used to suggest as the only effective means of engagement with political unionism is. Otto would not be best pleased but shared future didn’t begin to describe it. I will say that he believed in an agreed future.
LikeLike
OMG, S Armagh, your tongue is after getting too loose.
LikeLike
Stoneyford OA has 224 Catholics making up 36.25% of pop, indicating that intimidation campaign was only partially successful.
Re: Dundrum I never understood why mainly C village was covered in flags. Appeasement does not work.
LikeLike
Yes, but Stoneyford would have likely become majority Catholic with all the new builds and with Westies moving out to the sticks! It’s intimadating people from buying houses as well FF although I understand that is harder to prove. Ditto with Dundrum and other parts but from a friend in Newcastle he reckons there is a strong UVF mob centred around Clough/Dundrum whilst the Dundrum Catholics tend to be SDLP types.
LikeLike
I think it’s a given after all the publicity that people didn’t want to buy houses there. A couple of years of no nasty news-stories and cut-price houses will likely see the migration resume. AFAIK Stoneyford’s most famous resident has moved to Maghaberry.
LikeLike
FF,
Unless the prods force the Catholic’s out like they did in Graymount, Harmin in the mid 90s then areas will continue greening. That fear of demographic change is palying on the east Belfast Loyalists over the ‘Fleg’ protests. When the religion by age data comes out Ravenhill will most likely be majority catholic with Woodstock, The Mount, Island not far behind. same with Fortwilliam, Castleview and Duncairn in the north of the city. Infact amongst the youth only Duncairn (maybe) and Ballysillian will still have a Prod majority in the North Belfast DEA of Castle, Oldpark
LikeLike
Ormeau,
If I may say, I seem to remember that Rathcoole was intended as a mixed housing estate when originally built. One B. Sands grew up there I believe. Same story?
LikeLike
BD,
110 percent! You have to understand that parade challenges, inquiries, flags taken down are an affront to the Orange state of the 50/60s that they yearn to get back.
I can see this being a rough summer in the North with a failed and understaffed police force being pushed to the limits by the Loyalist Paras
LikeLike
Do you reckon we’ll get a rerun of Kristallnacht?
LikeLike
Some of my earlier posts have been on the Orange card being played at regular intervals, ie: the threat of violence against their state. It was very instructive the response I recieved. It is also interesting how, living in the “leafy suburbs of north down” the footsoldiers of the flag protesters, the FTP bands at St Matthews and the loyalist “Community workers” are viewed
LikeLike
Rathcoole was 33% Catholic some of my family lived in the estate but seen the way things were going in the late 60s and moved out. Ballybeen was also 33% Catholic at the start of the troubles but the UDA/UVF and the local tartan gangs pushed people out. There is a great website on St Anthony’s Parish Woodstock Road on the Belfast Forum if you are looking to find out about the campaign against East Belfast Catholics in the late 60s/early70s. In fairness it was not all one way because Lenadoon, Moyard, Springfield Park were majority Protestant at the start of the troubles. A sad time in our history.
LikeLike
These things happened – but in very different times.
LikeLike
FF,
I thought it might kick of around the flag protests to be honest. You can be sure that this map is being pored over on PULSE.
LikeLike
The question is what can they do about it? The big growth in the nationalist population is taking place in middle class areas. (The term class sticks in my throat by the way) The working class areas remain strictly defined. That is why the DUP are missing the big picture, eg: Girdwood
LikeLike
FF,
I hope not to see another troubles but Irish history has been filled with war between Planter and Gael, the seizure of Irish land, peep of days boys, sectarian riots of the 19th century, 1920s violence, troubles.
LikeLike
It has also been filled with invasions and the invaders becoming “more Irish than the Irish themselves”. celts, vikings, normans, the anglo Irish
LikeLike
BD as is normal with invasions but the planters never became Irish outside of a section around 1798.
LikeLike
All the examples I mentioned above actually did become part of the fabric of Ireland. They still are and rightly so. The divisions carefully fostered, and you know where I’m quoting that from, have resulted in what exists here and the events of recent times. I’m not religious at all as I have stated many times but it matters in the north because of the close relationship with voting patterns.
LikeLike
Yes – the differences were exploited by those whose interests lay in maintaining a weak Ireland. if there was no religious difference another would have to have been found/created. We can now work to undermine those differences. But that will not happen with a border to emphasise and nurture division. The border will have to go first.
LikeLike
Can I ask if anyone has seen the corridor developing in mid antrim between the Glensmen and the men of Ulster? This seems to be didviding the unionists into a large island in north antrim/east derry. Coupled with the corridor between Belfast and the lough coralling sheep comes to mind.
LikeLike
FF,
I think there was a lot more than Harbinson invovled in the violence but it is a ghastly place have you ever been near it? I am amazed why any Catholic or Protestant would want to live there, let alone bring up children there. Moira, Glenavy for me if I was to move to that part of the world.
LikeLike
Yeah, it’s a bit bleak up there, even without the hillbillies. Both the other spots you mention are nice.
LikeLike
I have spotted another error in the map. Kilwaughter ward to the west of Larne – population data is wrong, way wrong.
LikeLike
does anyone find it interesting the few solid areas with ‘Irish’ only? I know people have said the IRA lay down the guns because of demographic changes, but with no real massive defined areas ( bar sparse areas like the sperrins, tyrone,south armagh) saying Irish only, it could be a disaster!
LikeLike